That dashboard should be a skill
Refactor complex dashboards into skills.

Certain types of dashboards tend to accumulate complexity. With that complexity, usability trends toward zero.
Someone builds a useful report. More people start using it. Those people have different requirements, so the report gets a new filter, another tab and a few additional ways to group the data.
This is often a good thing. The dashboard is becoming a richer reflection of how the business actually works.
Eventually, though, it stops answering a defined set of questions and starts trying to contain a complex, branching analytical process in a single interface. The dashboard can notionally satisfy every requirement but, ugh, who wants to use it.
Code helps, to a point
Evidence handles this type of UI complexity particularly well because Evidence reports are defined in code. We offer UI primitives that simply don’t exist in legacy BI tools.
Conditional blocks can reveal content only when it becomes relevant, based on the data or an input. Loops can generate focused views for different accounts, products or regions. Inputs can appear beside the content they control instead of being collected in a filter bar.
These tools make it easier to manage cognitive load and keep a dashboard usable for longer. But even these affordances don’t scale forever.
Enter skills
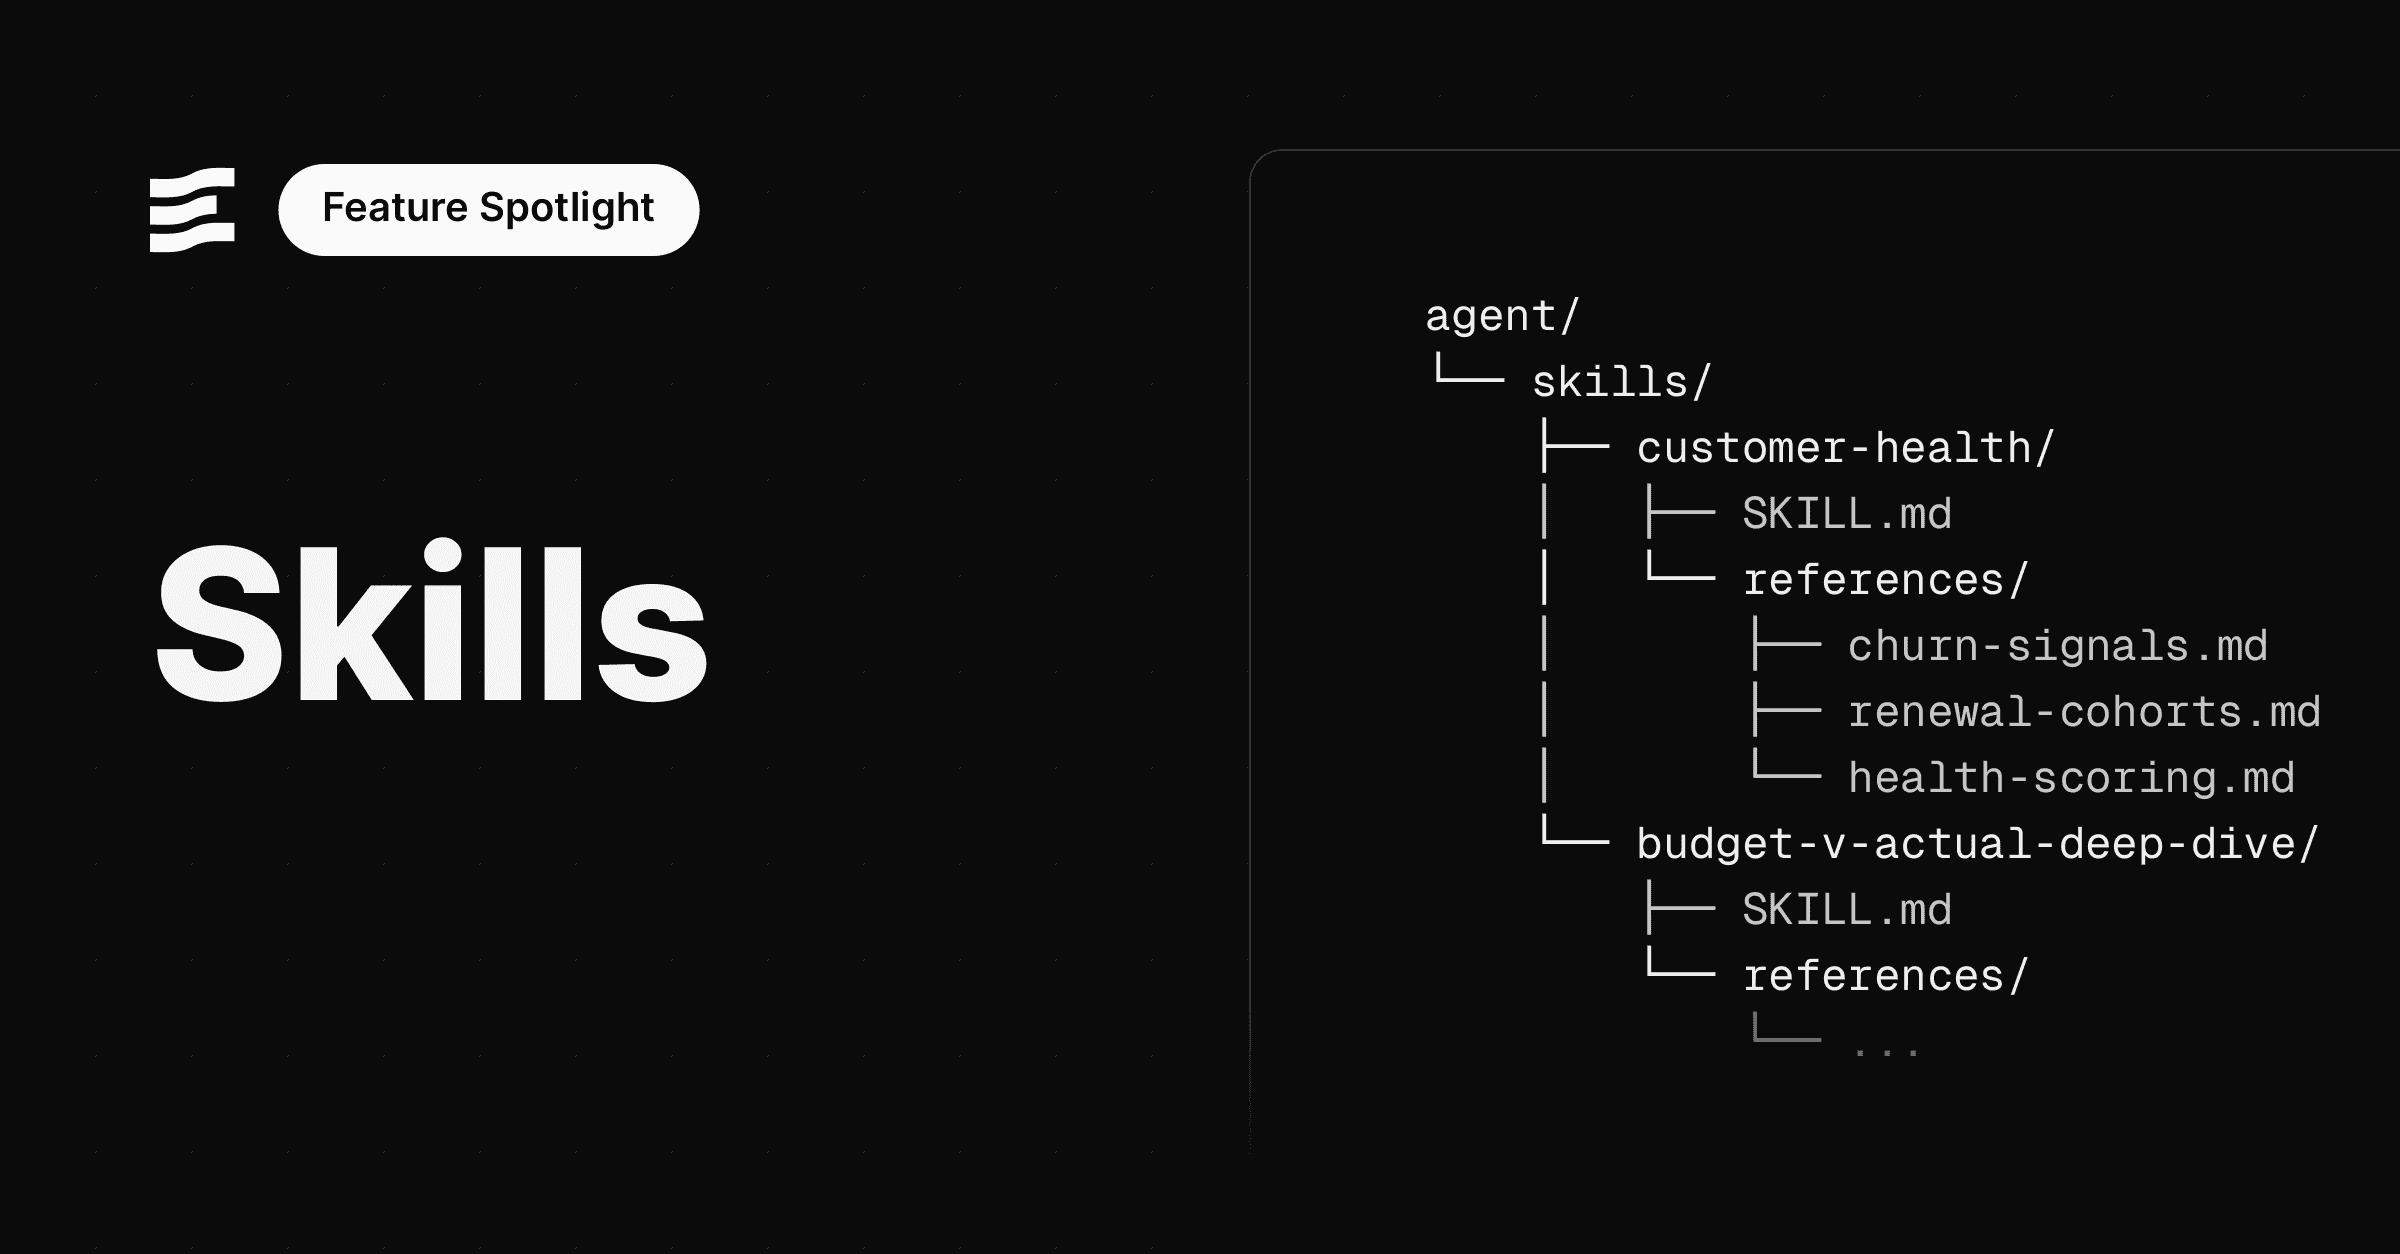
In the Evidence Agent, each skill is a folder in the project repo. At its centre is a Markdown file called SKILL.md that describes how the agent should complete a particular type of analysis.
Skills can include the questions the agent should ask and example queries, visualizations and generative UI to use in the response. They can point to reference material, invoke other skills, and even call out dashboards whose results or definitions the analysis must reconcile against.
Users are no longer faced with the full complexity of the interface at once. The agent reads the skill, asks the relevant questions and guides them through the analysis. From there, the user can steer, backtrack or explore further as the results emerge.
Because skills live in the repo, the data team can preview, test and deploy changes through the same development process as the rest of the Evidence project.
From dashboard to skill
One of our customers recently refactored their customer-health dashboard into a skill.
The dashboard had started with one input: choose a customer. The first version showed product usage, support history and a renewal date. Over time it accumulated buying-group rollups, workspace-level results, onboarding cohorts, feature adoption and comparisons against previous contract periods.
The dashboard encoded analytical patterns particular to the business, along with its visualization standards. There was a lot of valuable work in it. Using it, however, required knowing the customer-health methodology well enough to select the right inputs yourself.
The skill can identify that an account belongs to a larger buying group and ask whether the user wants to review the group or one workspace. It can select the relevant comparison cohort, look for unusual changes and investigate which products and teams account for them before producing a focused report.
The resulting skill is still a data product. It is version controlled, reviewed and improved over time. For users, it is much easier: they get the relevant analysis without navigating the entire procedure on a page.
Refactoring is easy
When your dashboards are already defined in code, coding agents can easily refactor them into skills. They can reuse the existing queries, definitions and visualizations, leaving you to simplify the dashboard or deprecate it entirely.