
Internal Analytics
as Code
A modern workflow for building, version controlling, and publishing reporting across your organization
The modern front-end for data work
Professional Design
Publication-quality visualizations designed for all device sizes
Superior Performance
Sub-second interaction time, even on millions of records
Modern Dev Experience
Build dashboards & reports in markdown, backed by version control and testing
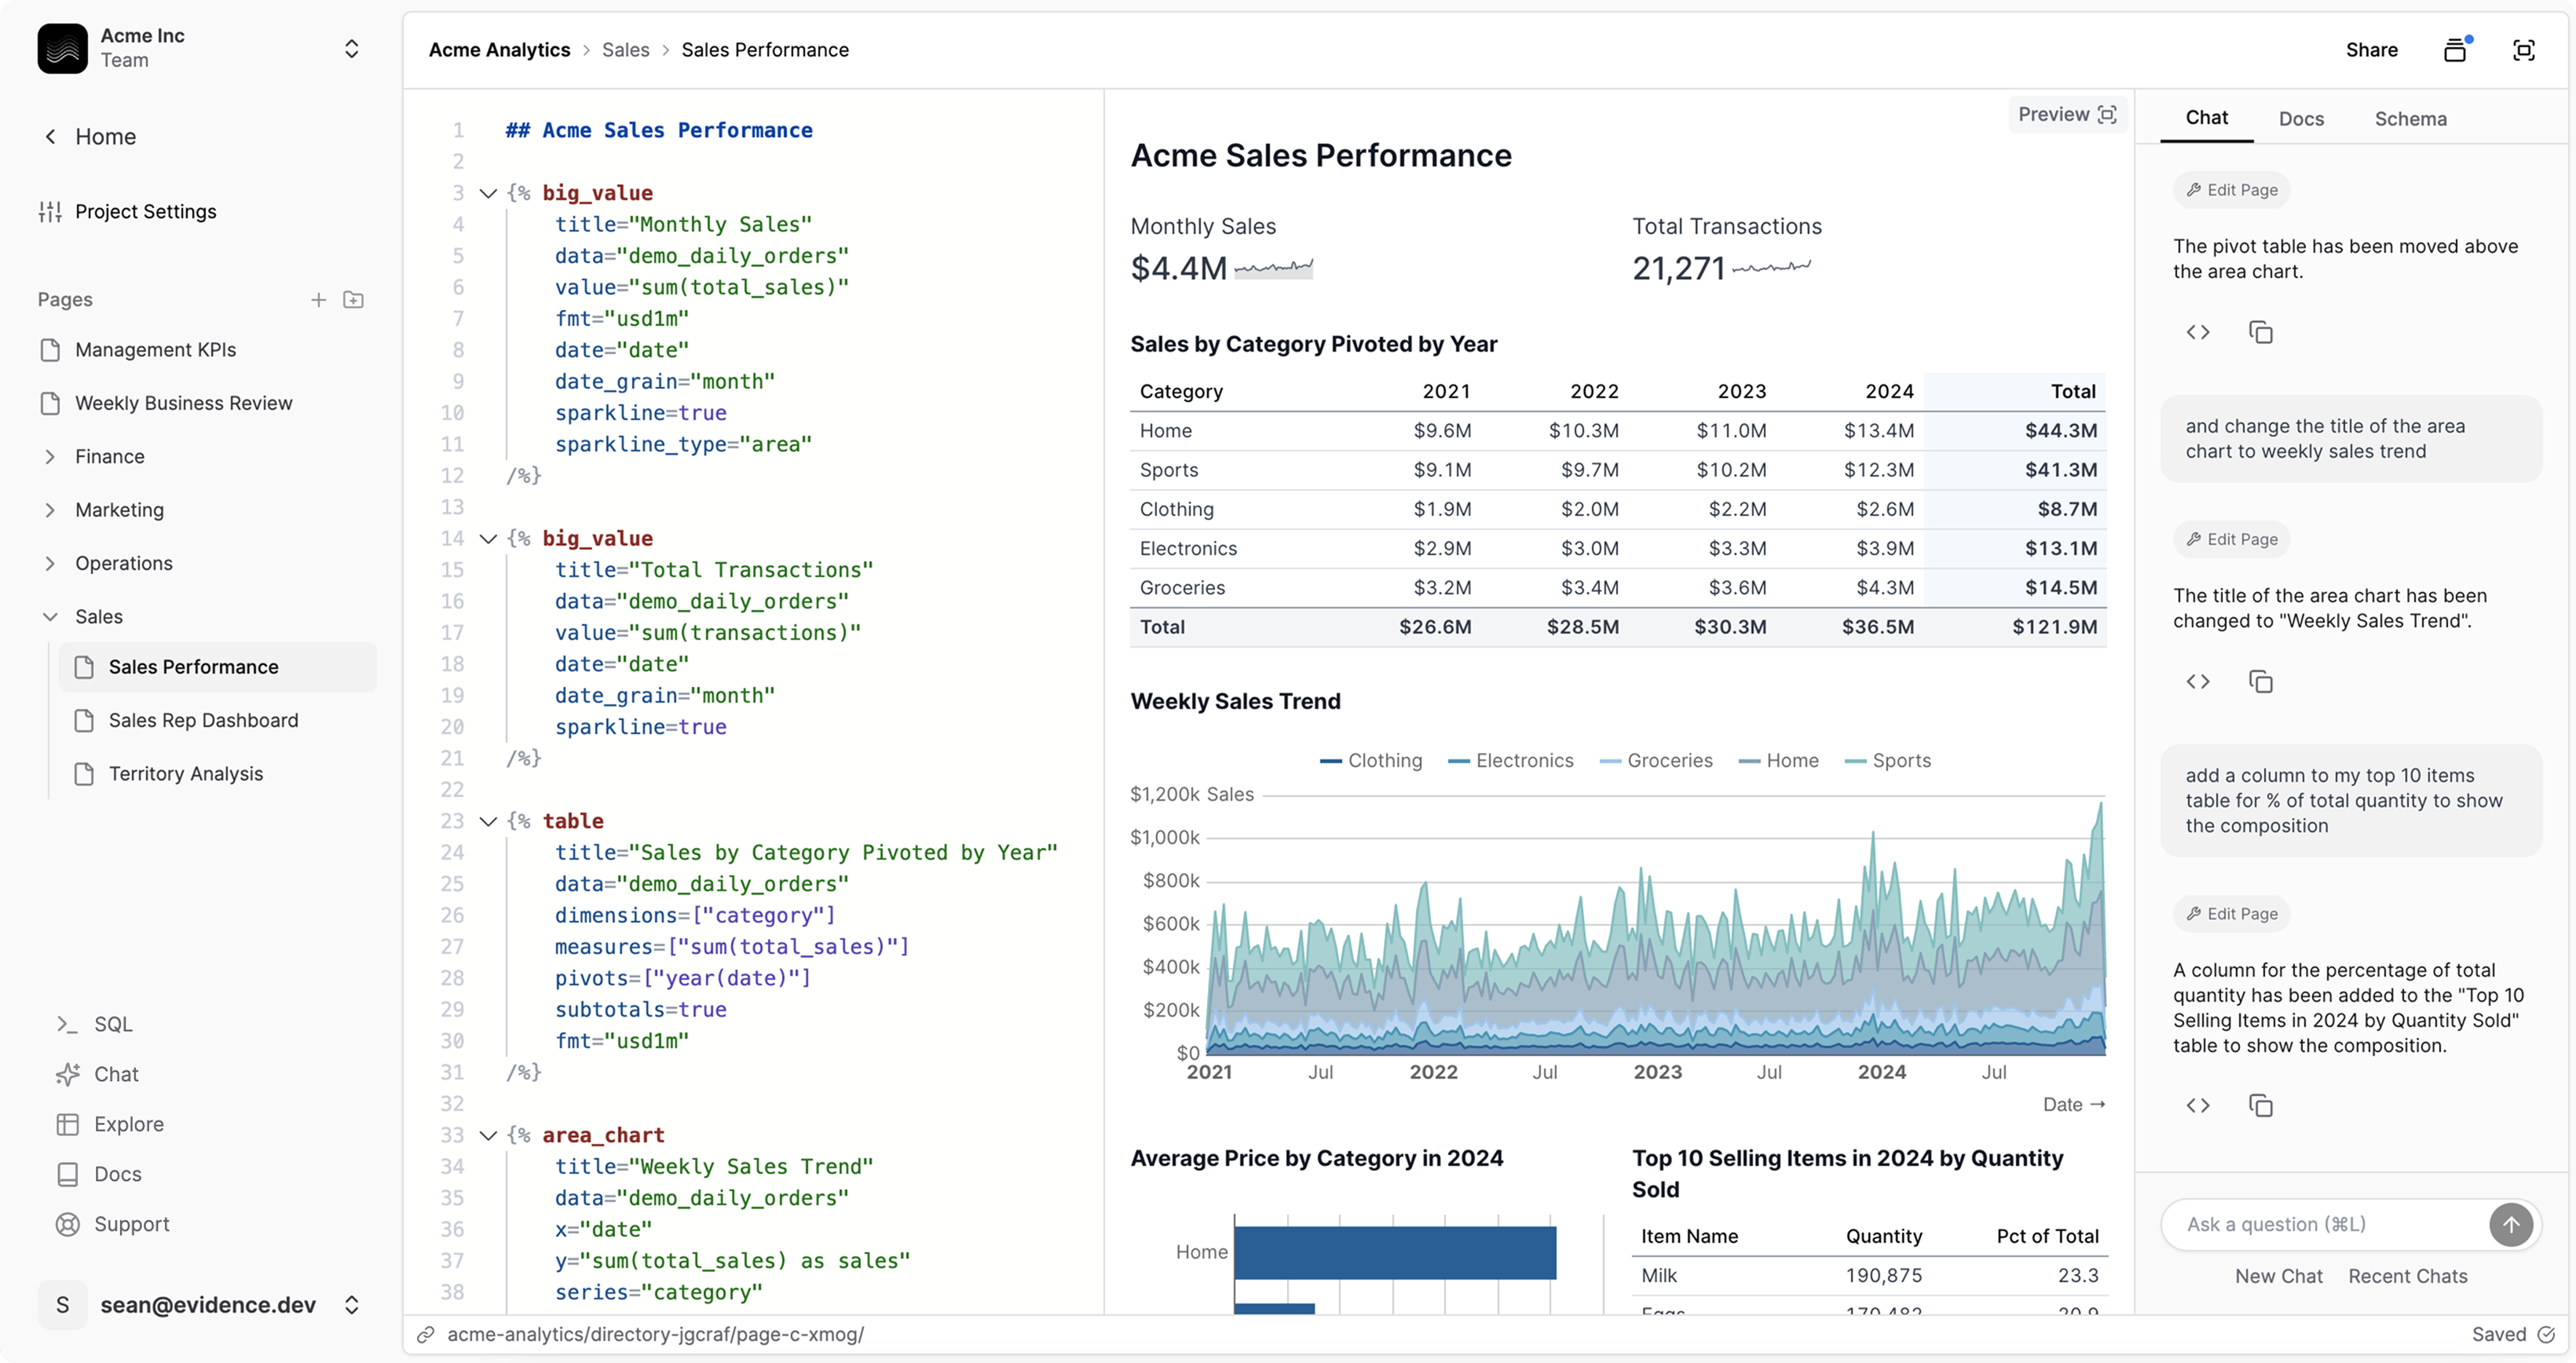
Define reports as code
Build internal analytics using SQL and markdown. Version controlled by default, reviewed before publishing, and owned by your data team. No drag-and-drop interfaces or UI-driven workflows.
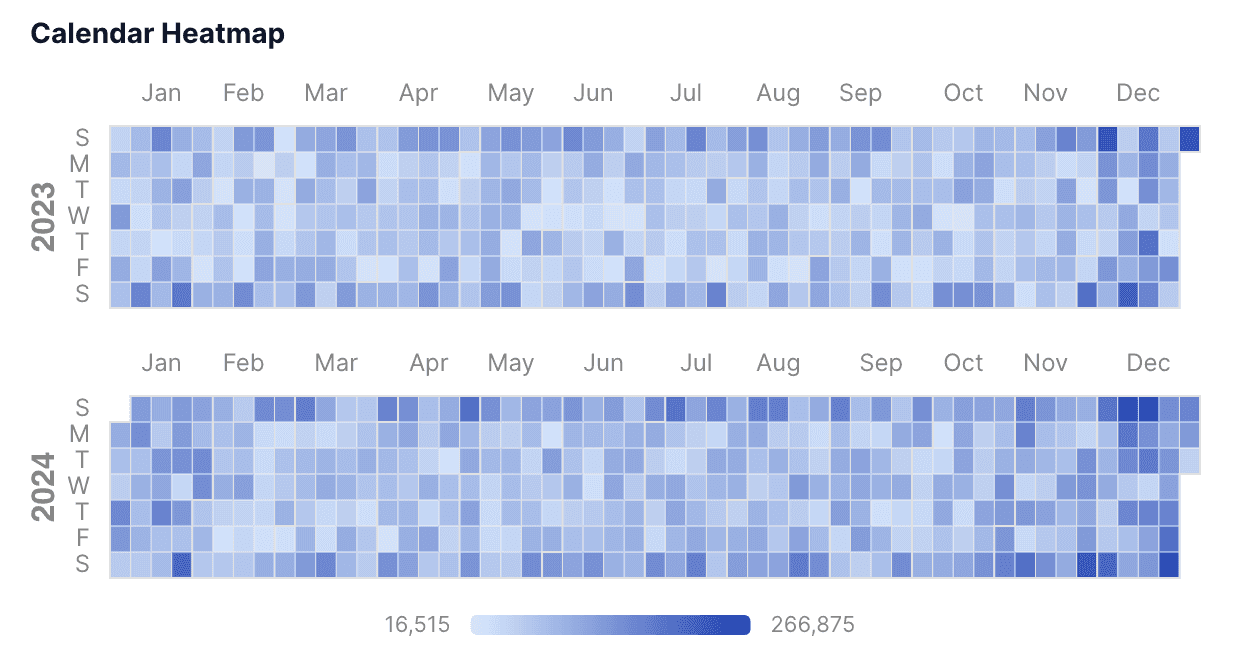
{% calendar_heatmap
  title="Calendar Heatmap"
  data="orders"
  date="date"
  value="sum(sales)"
/%}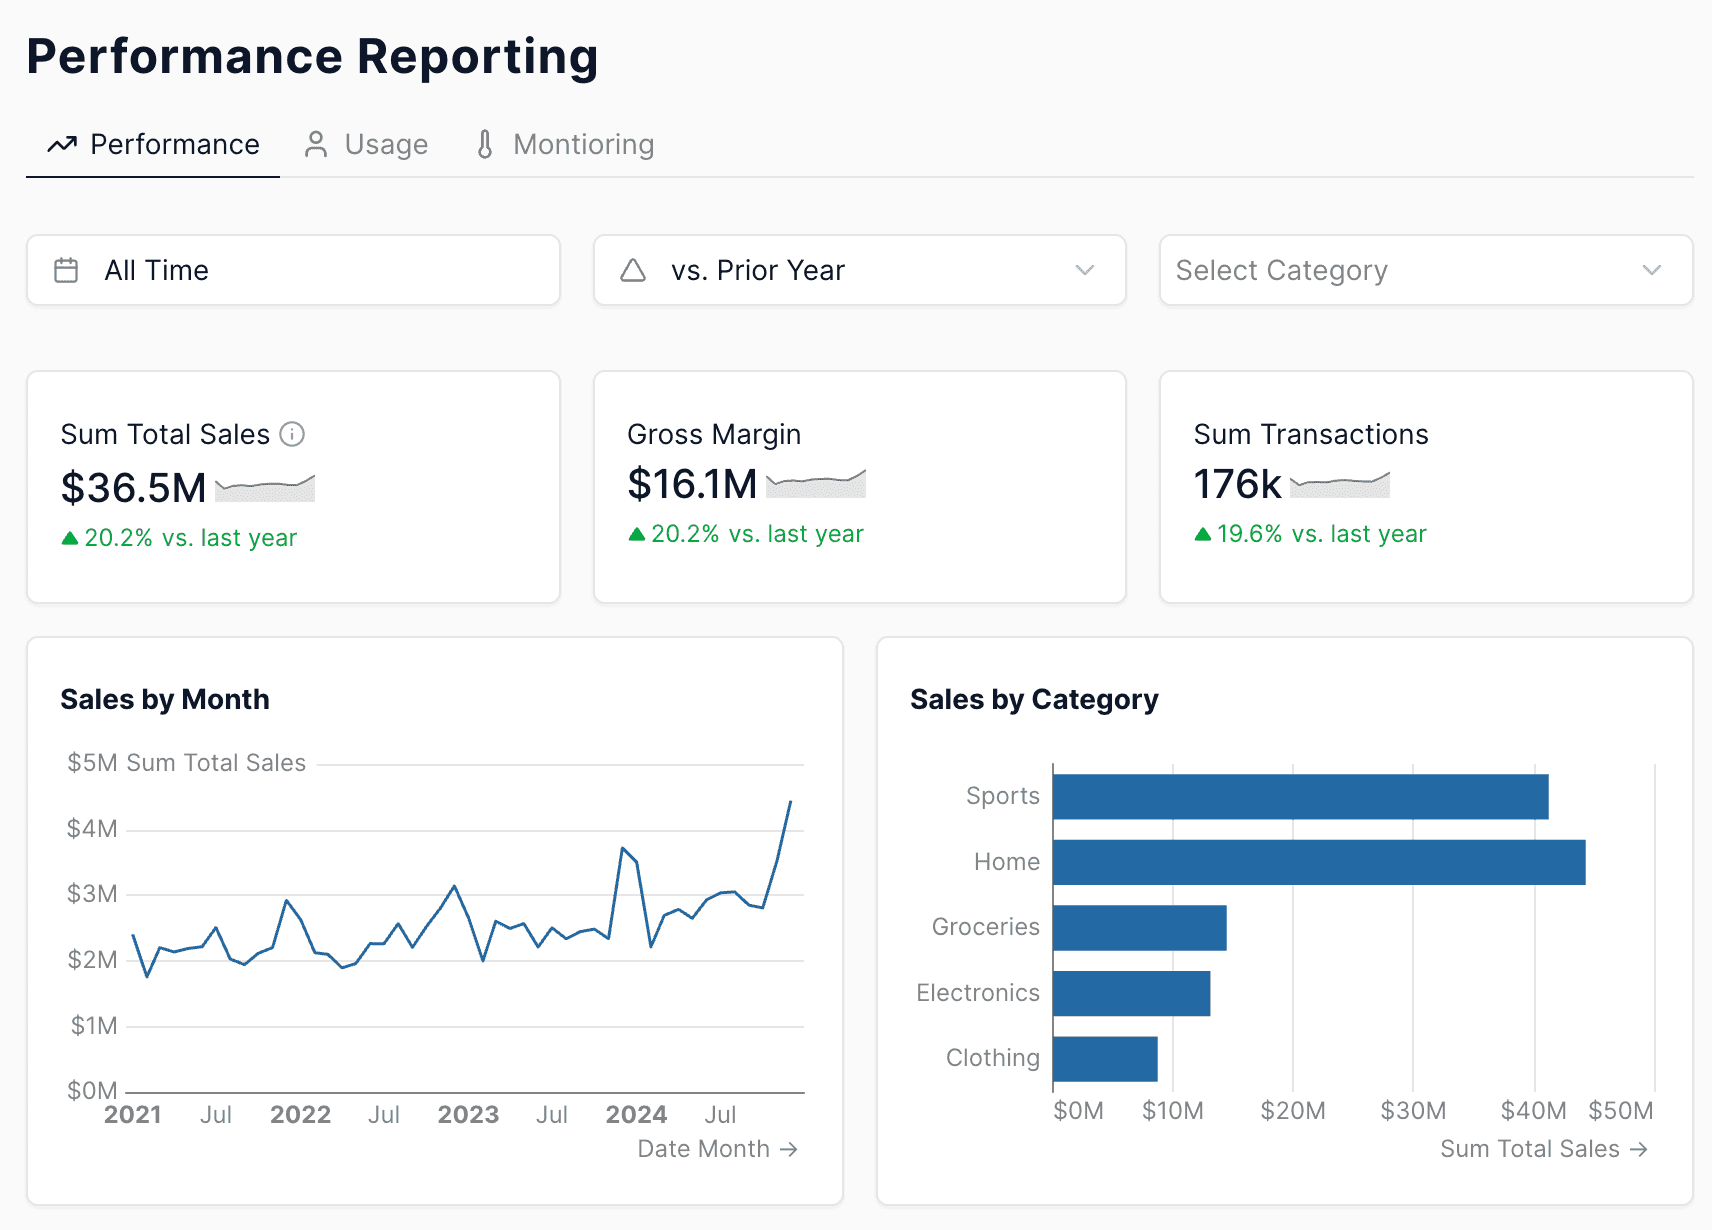
Professional design, out of the box
Built-in components for every visualization type. Production-ready layouts and interactions that work together seamlessly. Reports feel polished and native, even without custom styling.
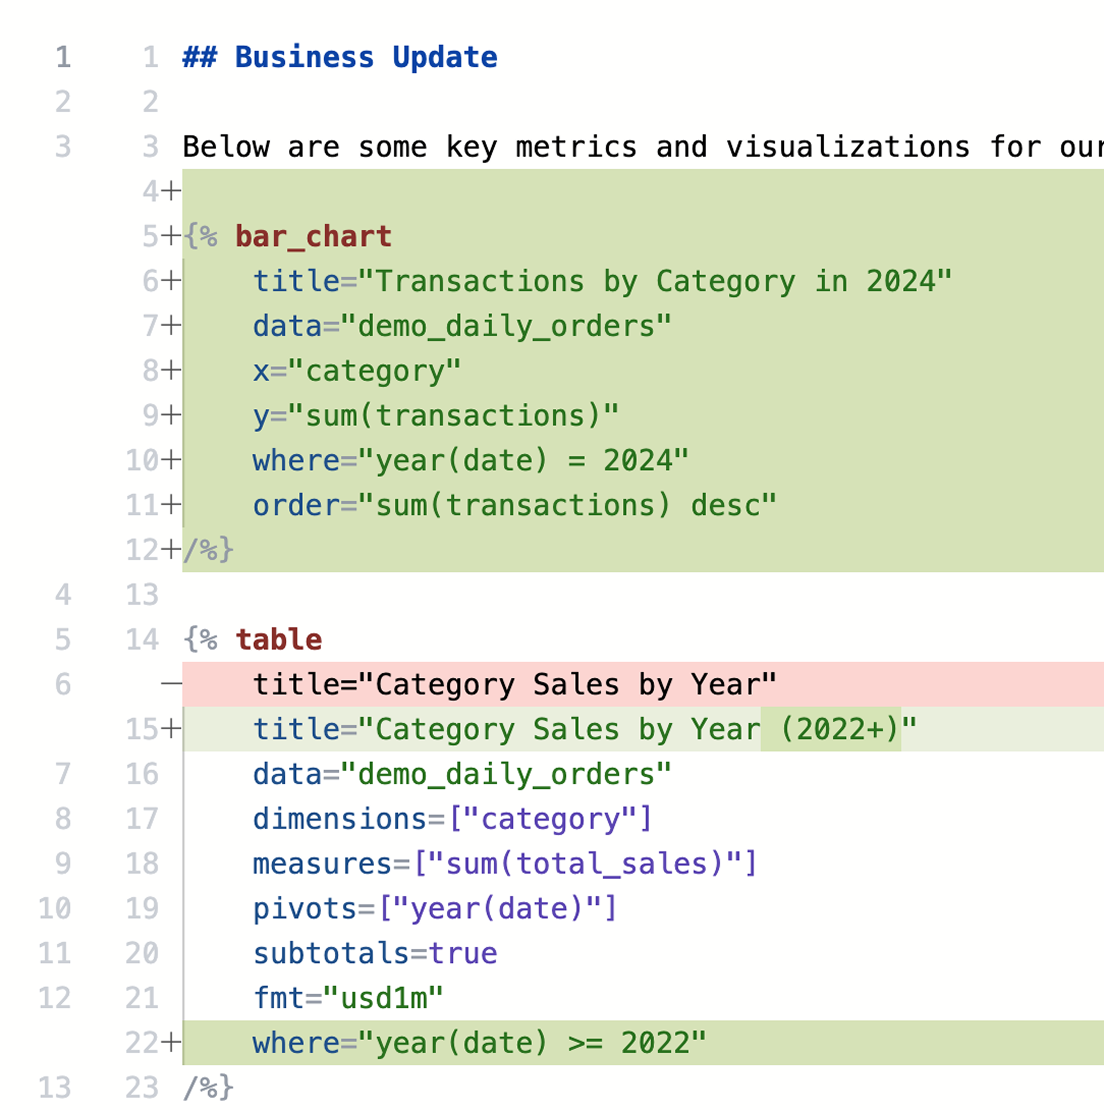
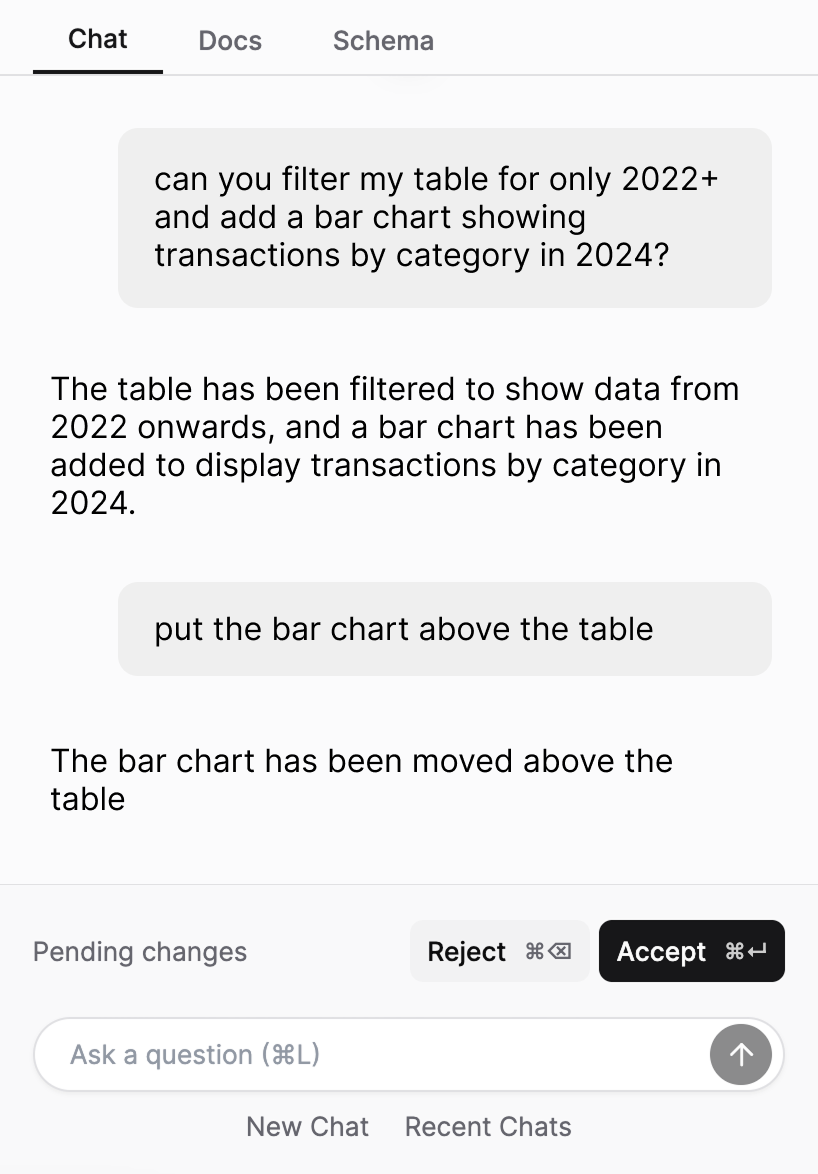
AI-enhanced development
Speed up your workflow with an AI agent that understands your schema, debugs errors, and writes Evidence markdown. Get help when you need it, without leaving your IDE.
Built for interactive speed
Sub-second interaction time, even on millions of records. Optimized query engine with intelligent caching and automatic scaling. Fast dashboards for your users, without manual tuning.
Control who sees what
Page-level access control for sharing dashboards across your organization. Row-level security to filter data by user. Give stakeholders access to the reports they need, without exposing data they shouldn't see.
| Department | Region | Revenue |
|---|---|---|
| Sales | East | $842K |
| Sales | West | $1.2M |
| Marketing | East | $620K |
| Sales | Central | $956K |
| Engineering | West | $0 |
| Product | Central | $0 |
Single Sign-On
SAML and SSO integration
Multi-Region Support
Global data residency across 20+ regions
Dedicated Support
Private support channel and priority assistance
Enterprise-ready
SOC 2 Type II certified. Store data in 20+ global regions. SSO and SAML support. Dedicated support for teams at scale.
