How to track On-Time Delivery using SQL
How to implement on time delivery metrics in your business, and why they are key to customer satisfaction.

Why are On-Time Delivery metrics so important?
When customers’ orders are not delivered on time, they may miss their delivery, or it may arrive too late to be useful.
Ensuring a high on-time delivery rate protects customer satisfaction, so it’s important to measure if customers are receiving their items on time.
 |
|---|
| A flawless handover |
Definition
On-Time Delivery (OTD), sometimes called On-Time Performance, or On-Time Percentage (OTP) measures the percentage of orders that are delivered on time:
Calculating On-Time Delivery
In order to calculate the OTD %, we need to know when the deliveries were meant to be delivered, and when they were actually delivered.
Assuming we are starting with the below data from 100,000 deliveries, which is stored in a database. For each order delivery_slot_start and delivery_slot_end mark the time period when the delivery was expected, and delivery_time is when the delivery was actually made.
select
    order_id,
    delivery_slot_start,
    delivery_slot_end,
    delivery_time
from deliveries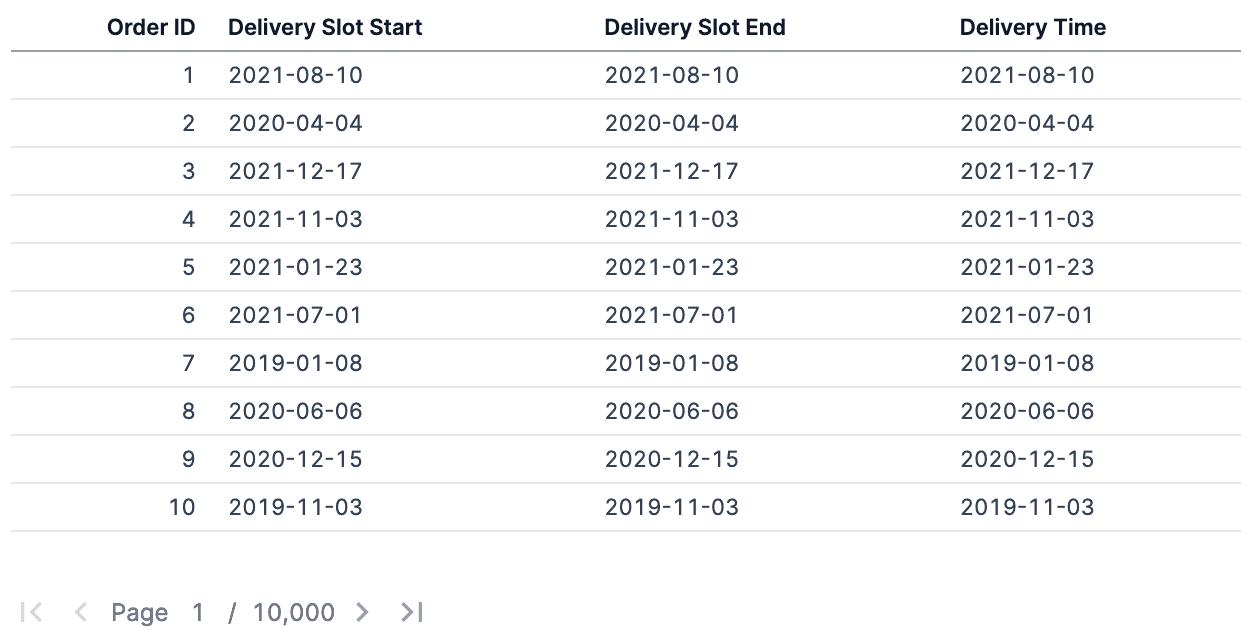
We first compare the delivery time to the start and end of the delivery slot to determine if the order was delivered on time, early, or late.
select
    order_id,
    delivery_slot_start,
    delivery_slot_end,
    delivery_time,
    case
        when delivery_time > delivery_slot_end then 'Late'
        when delivery_time < delivery_slot_start then 'Early'
        else 'On-Time' end as delivery_status
 from deliveries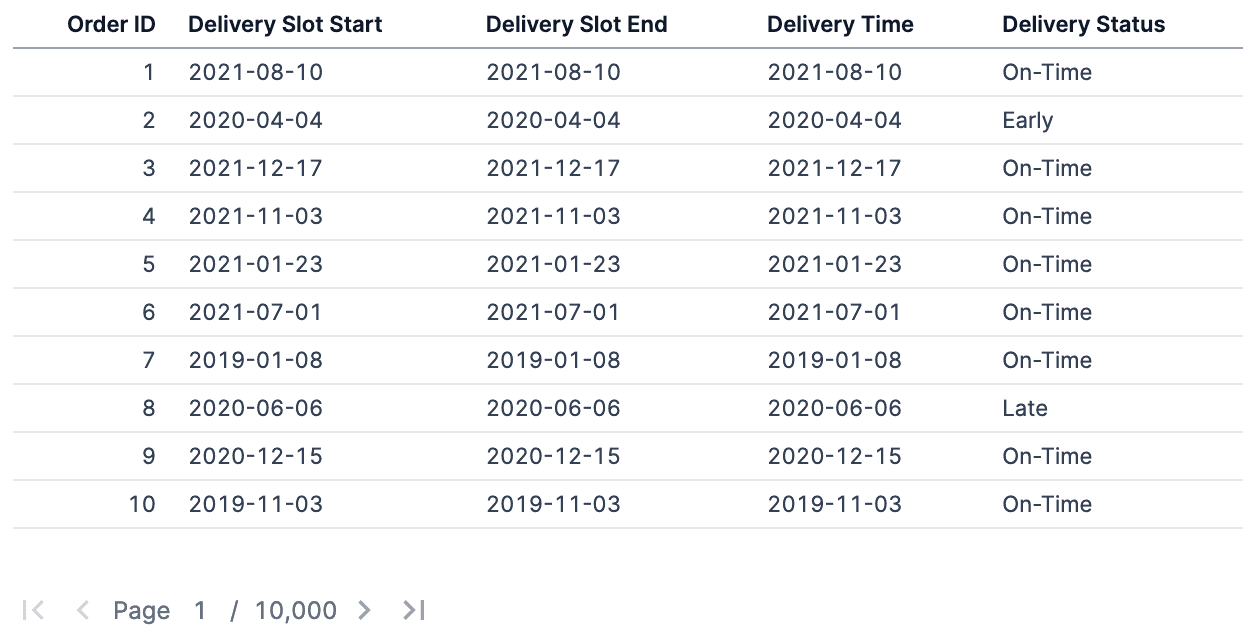
From here, we can calculate the OTD % for each month in the dataset.
select
    substr(delivery_slot_start, 0,7) as delivery_mon,
    count(*) as total_deliveries,
    round(count(case when delivery_status = 'On-Time' then 1 end)*1.0/count(*),2) as on_time_pct,
    round(count(case when delivery_status = 'Early' then 1 end)*1.0/count(*),2) as early_pct,
    round(count(case when delivery_status = 'Late' then 1 end)*1.0/count(*),2) as late_pct
from ${deliveries_classification}

where delivery_mon not like '2022-01'
group by delivery_mon
order by delivery_mon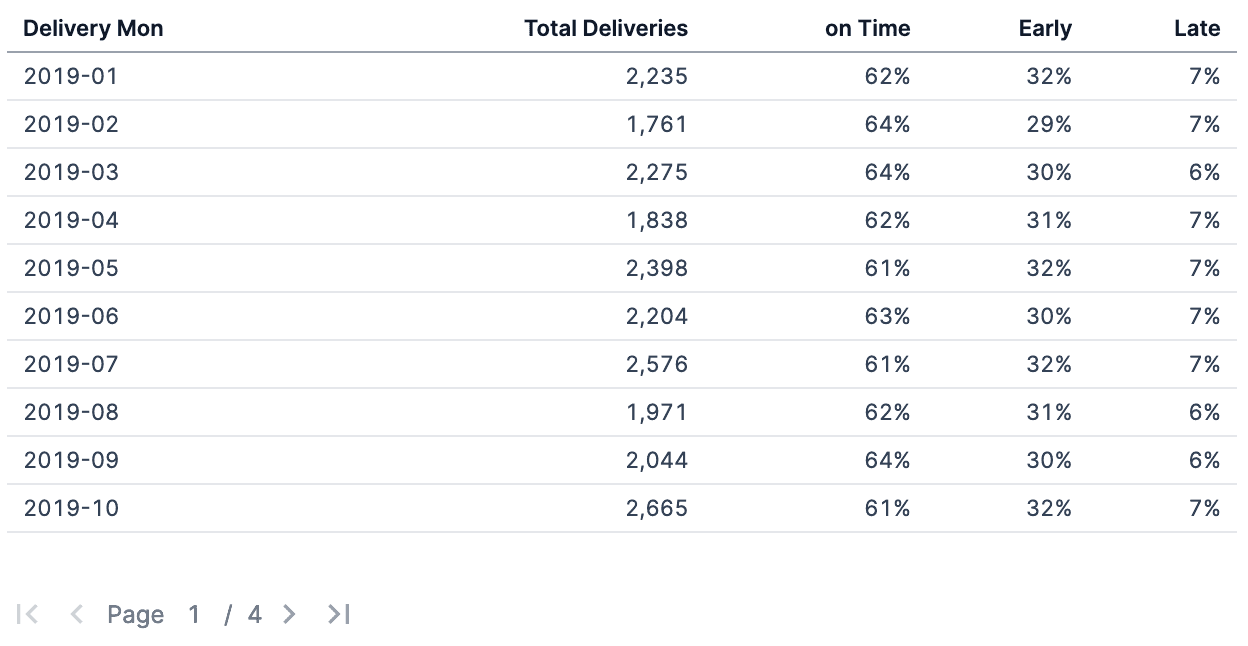
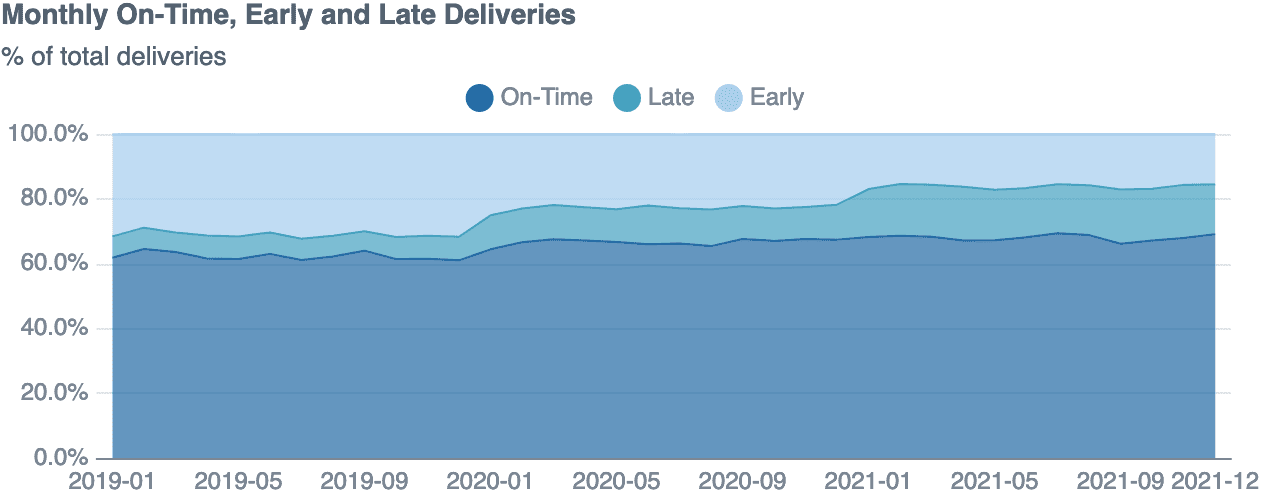
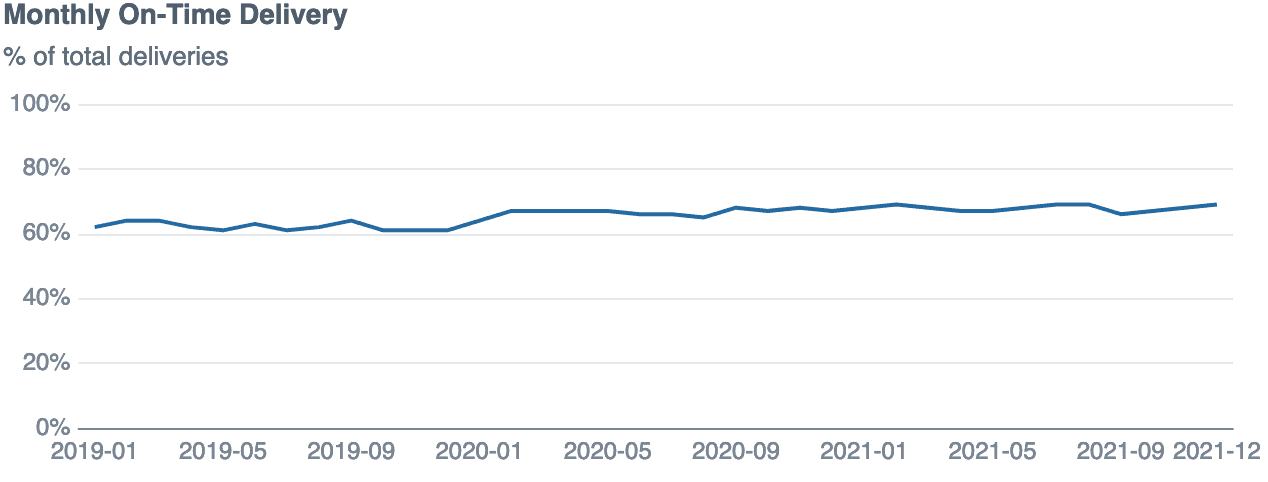
Presenting On-Time Delivery Metrics
On-time delivery metrics are typically presented as a time series, allowing the viewer to see the OTD % for each month.
We can use Evidence to plot a line chart to see how the OTD % changes over time:
We can also use an area chart to help show the proportion of deliveries that were late or early:
select
    substr(delivery_slot_start, 0,7) as delivery_mon,
    delivery_status,
    count(*) as total_deliveries,
    round(count(*)*1.0/sum(count(*)) over (partition by substr(delivery_slot_start, 0,7)),3) as deliveries_pct
from ${deliveries_classification}

where delivery_mon not like '2022-01'
group by delivery_mon, delivery_status
order by delivery_mon, delivery_status desc