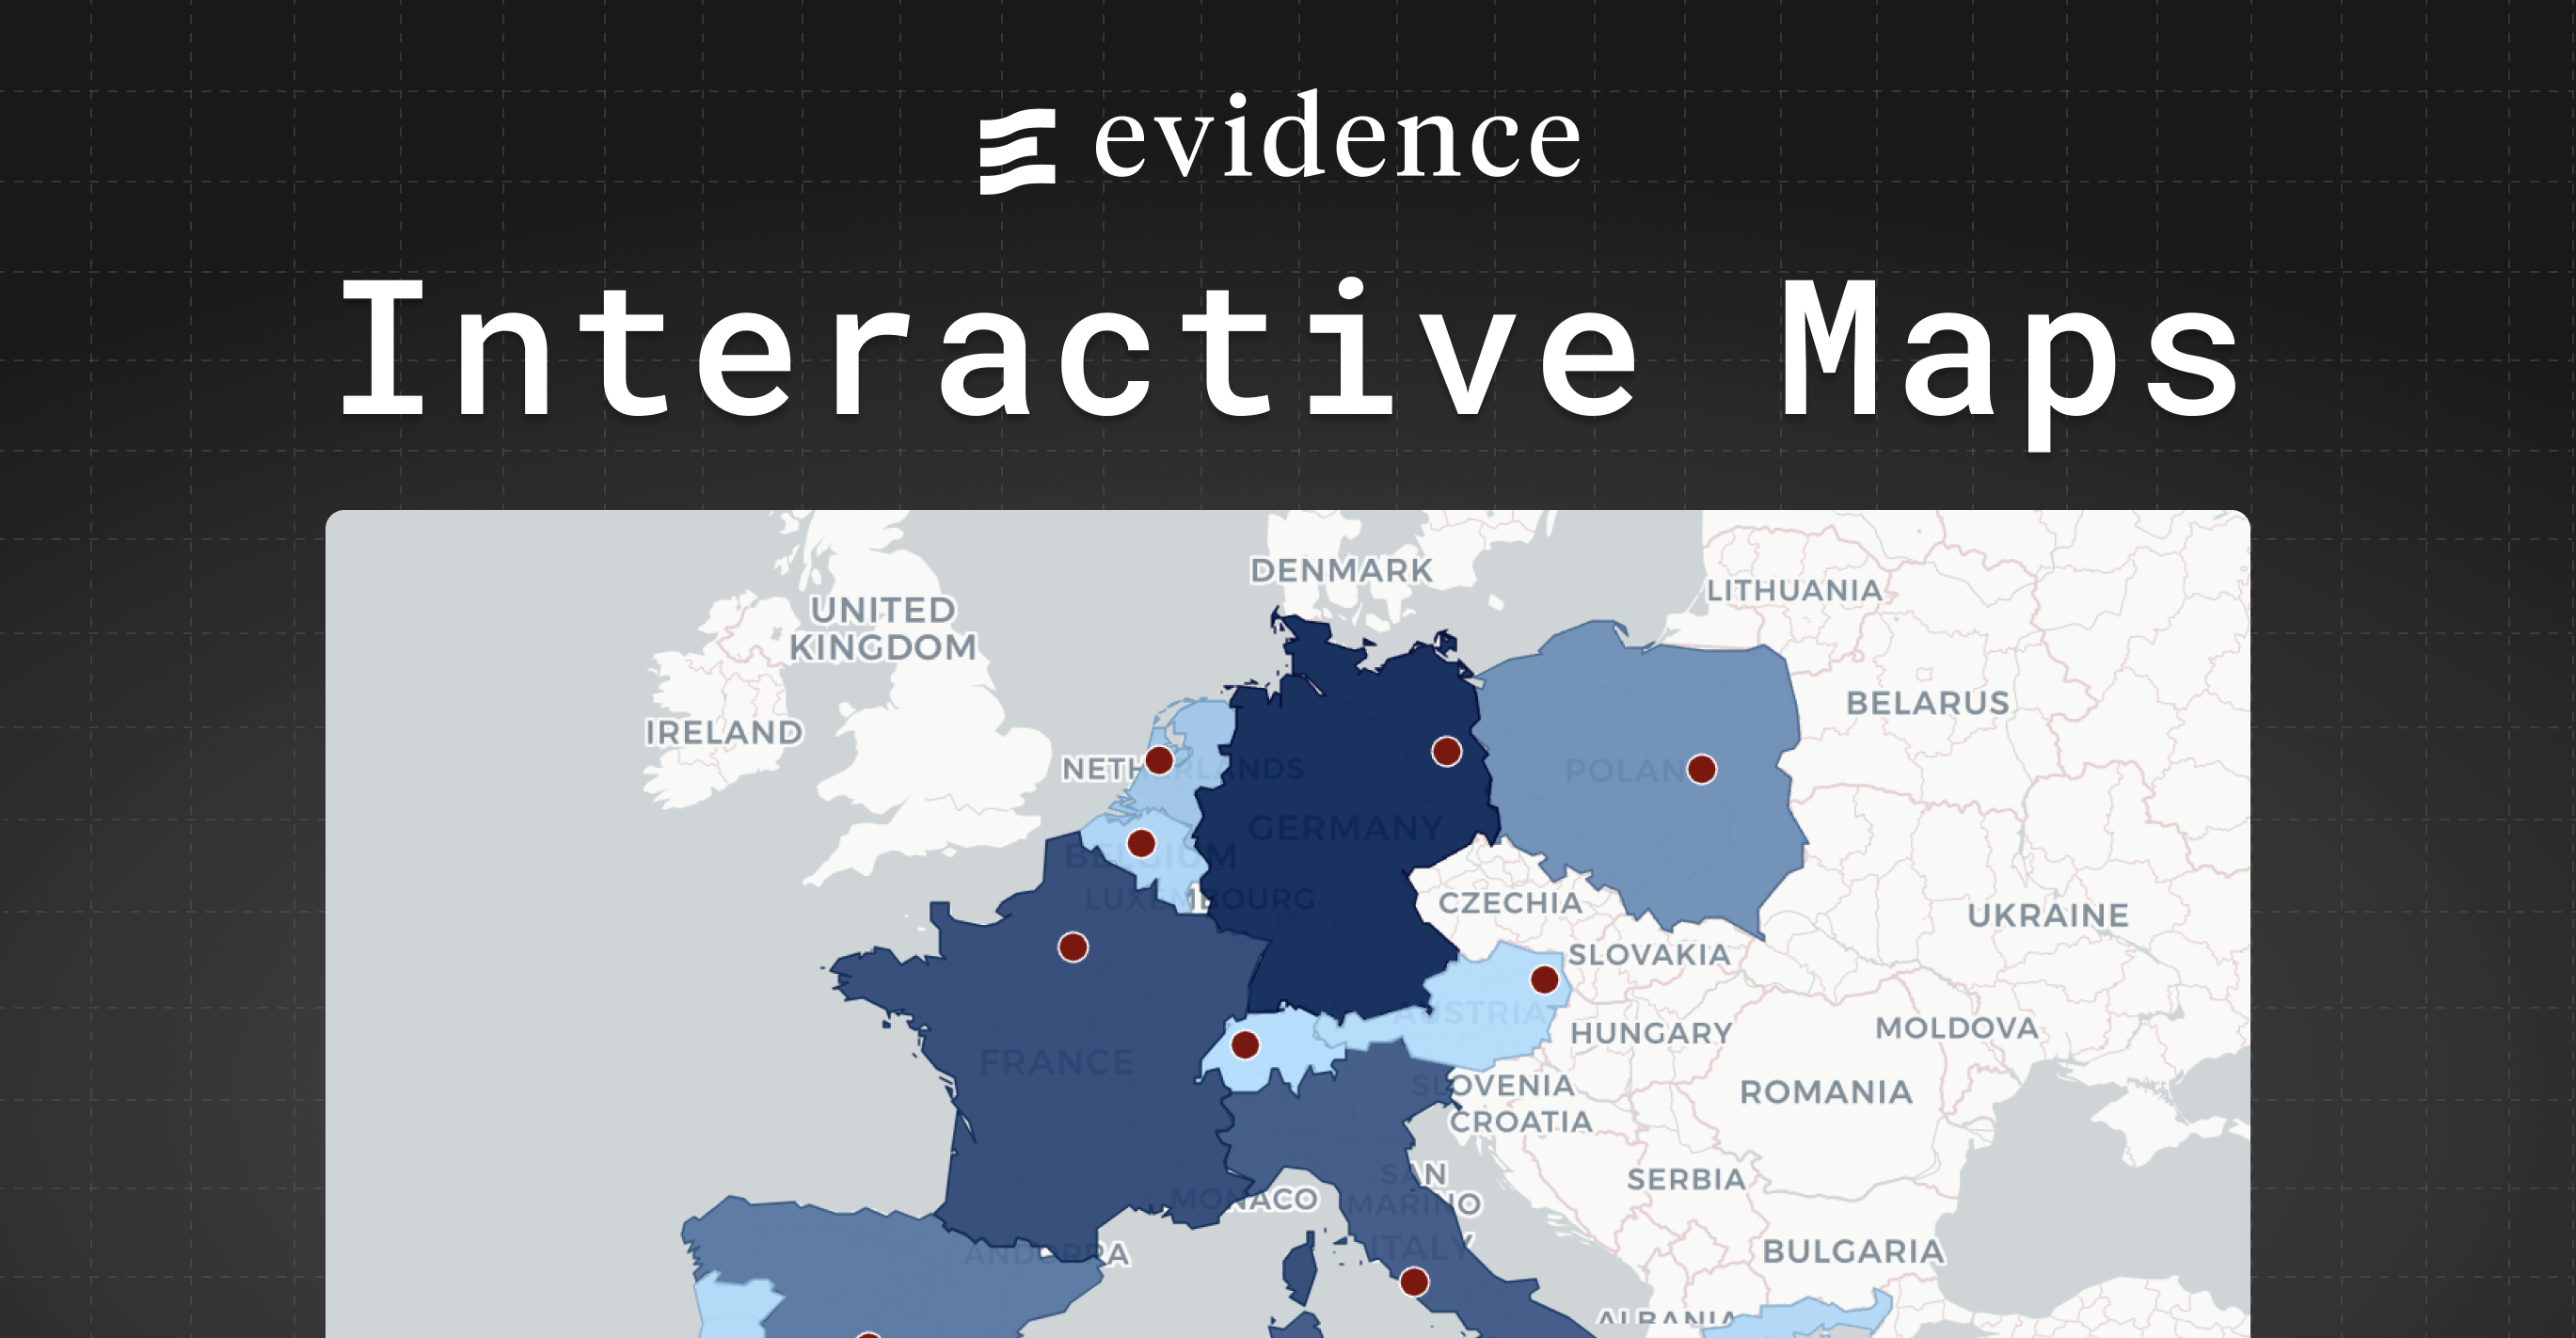
Introducing Interactive Maps
Our community has been eagerly awaiting the addition of maps to the Evidence component library. Today we’re thrilled to share the launch of 4 new interactive map types.
These are our most customizable components to date, letting you define custom tooltips, basemaps, and color palettes - among other options.
These maps also include interactive features for cross-filtering and drill-down links, making it possible to build highly interactive and intuitive data apps.
As always, these components are designed to work well across all device sizes, from mobile phones to ultrawide monitors.
This is an exciting step forward for our visualization library and we’re looking forward to seeing what people build.
AreaMap
Easily create custom choropleth maps with the AreaMap component. Display regions from a geoJSON file, apply a color scale, and add interactivity.
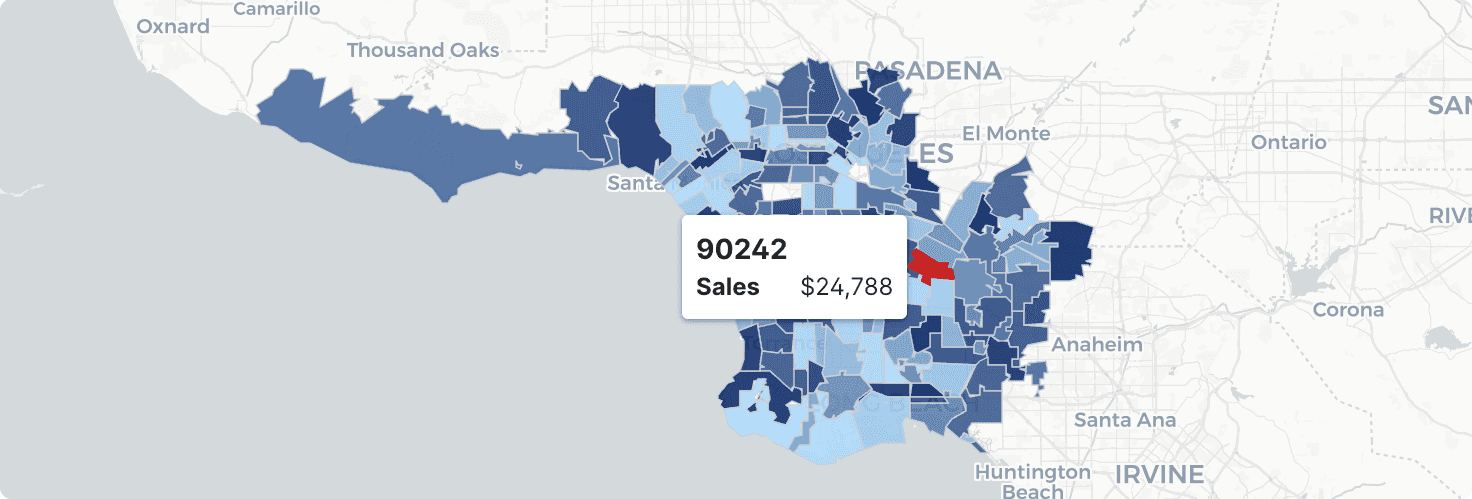
AreaMap can accept a local geoJSON (stored in your project’s static folder) or a geoJSON URL.
PointMap
Use PointMap to display points of interest - great for visualizing things like store locations.
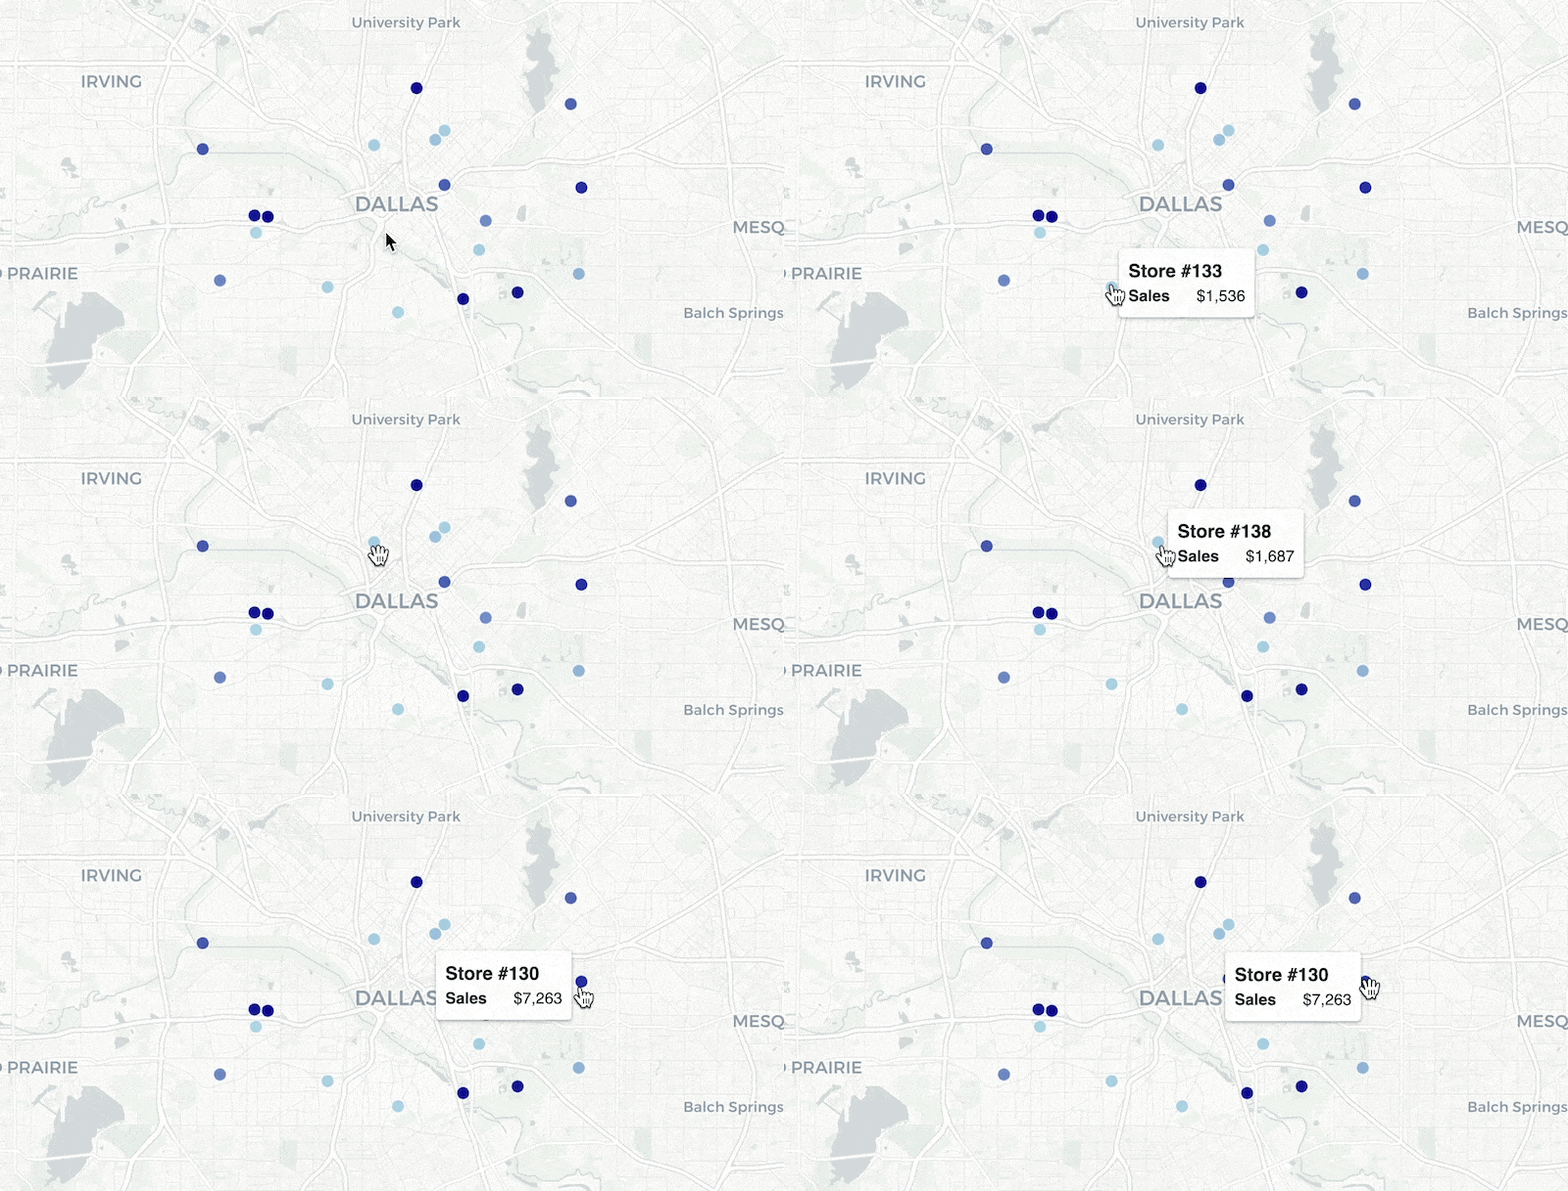
PointMaps can be created with the same color across all points, or using a color scale defined by a value column in your query.
BubbleMap
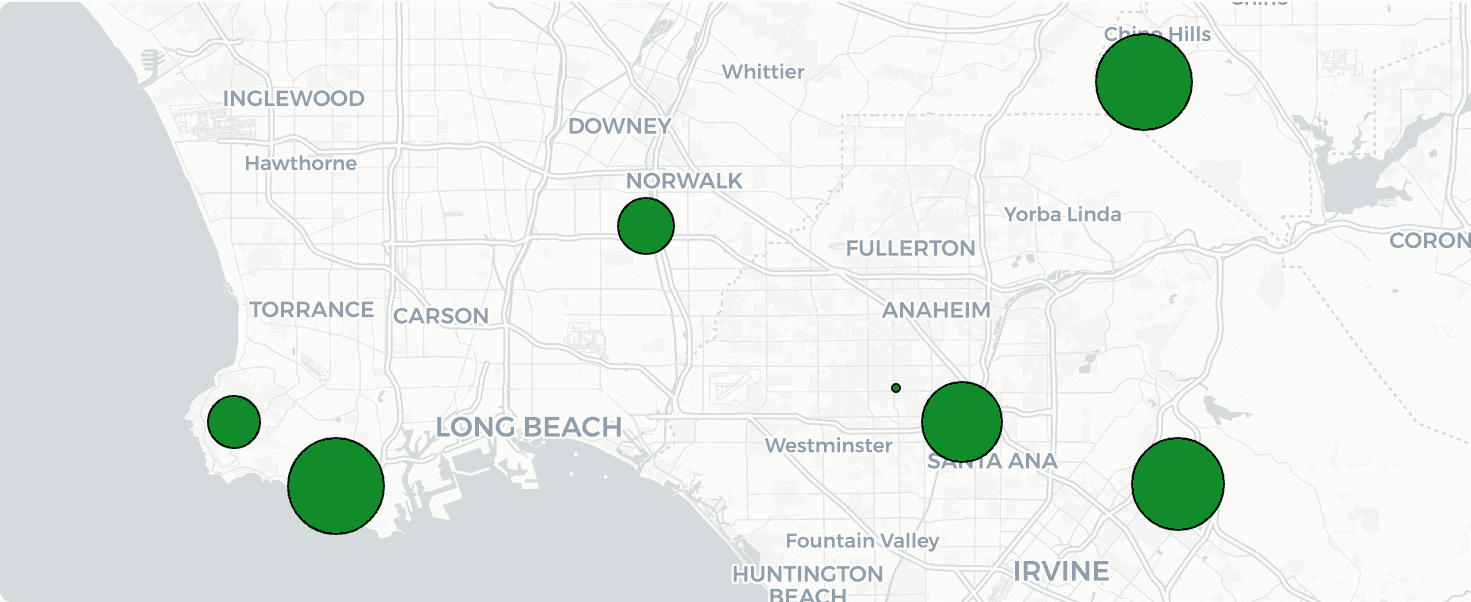
BubbleMap is similar to PointMap, but with the ability to pass a size column to generate bubble sizes defined by your data. 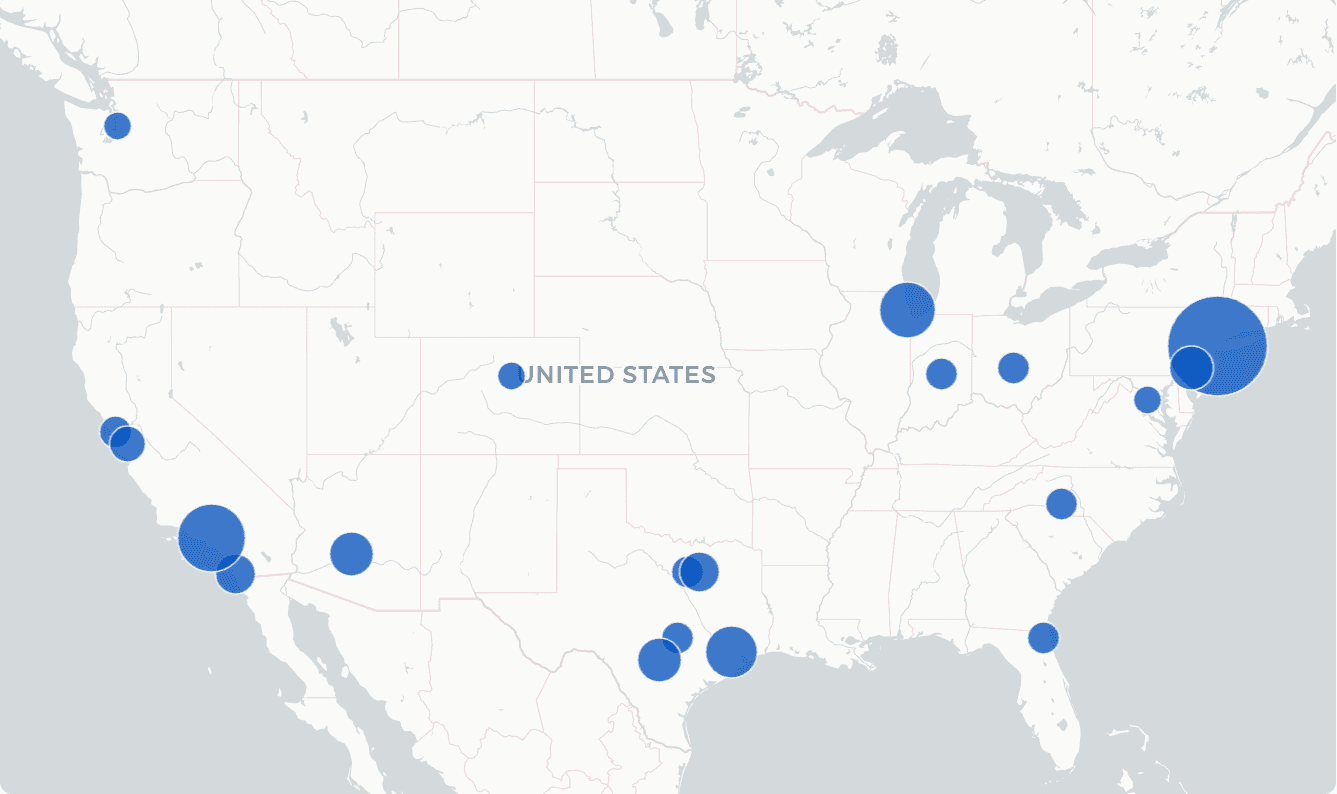
BaseMap
BaseMap lets you combine multiple map layers into a single map. Bubbles on top of areas, points inside of bubbles - whatever you need to display. BaseMap’s composable syntax makes it possible to include as many layers as you need, each with their own style and interactivity settings. 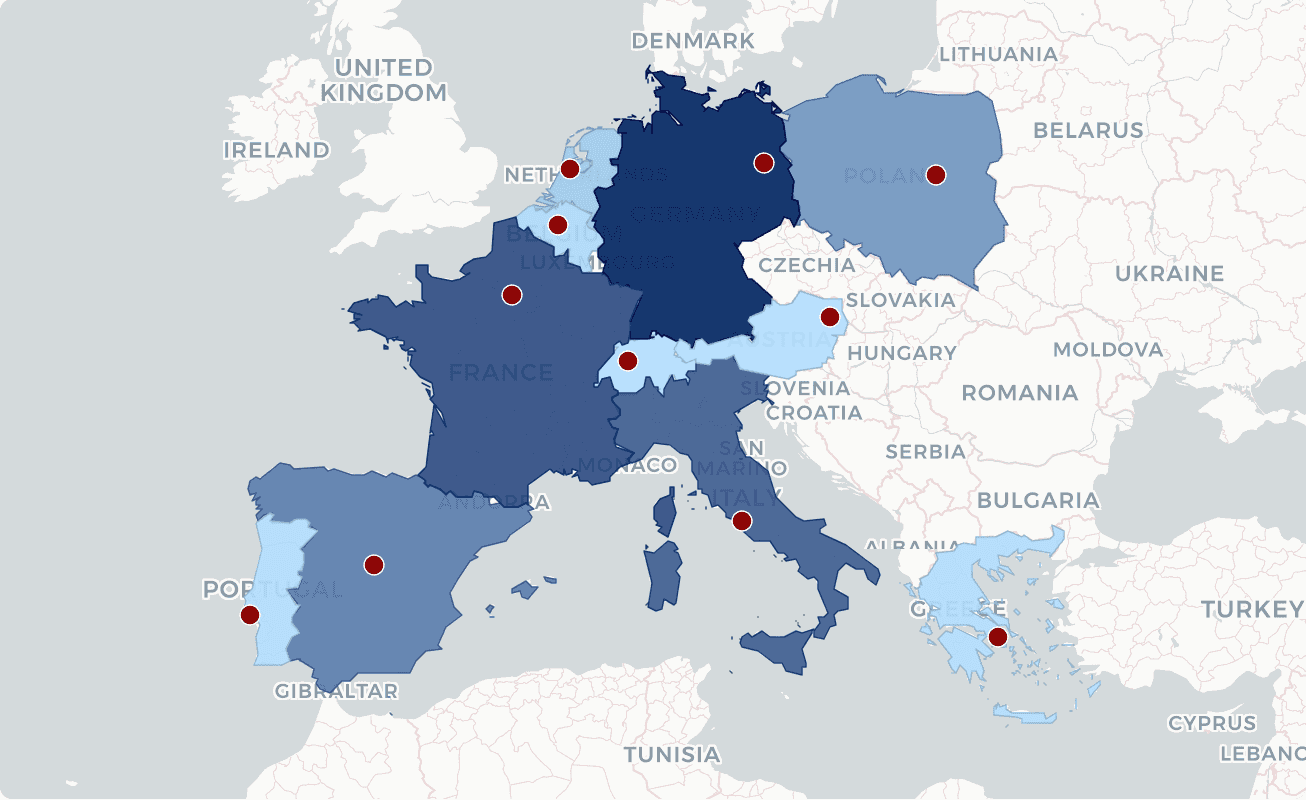
Interactive Features
Maps as Inputs
After launching input components in our Universal SQL release, we’re continuing to expand the use cases for inputs across our component library.
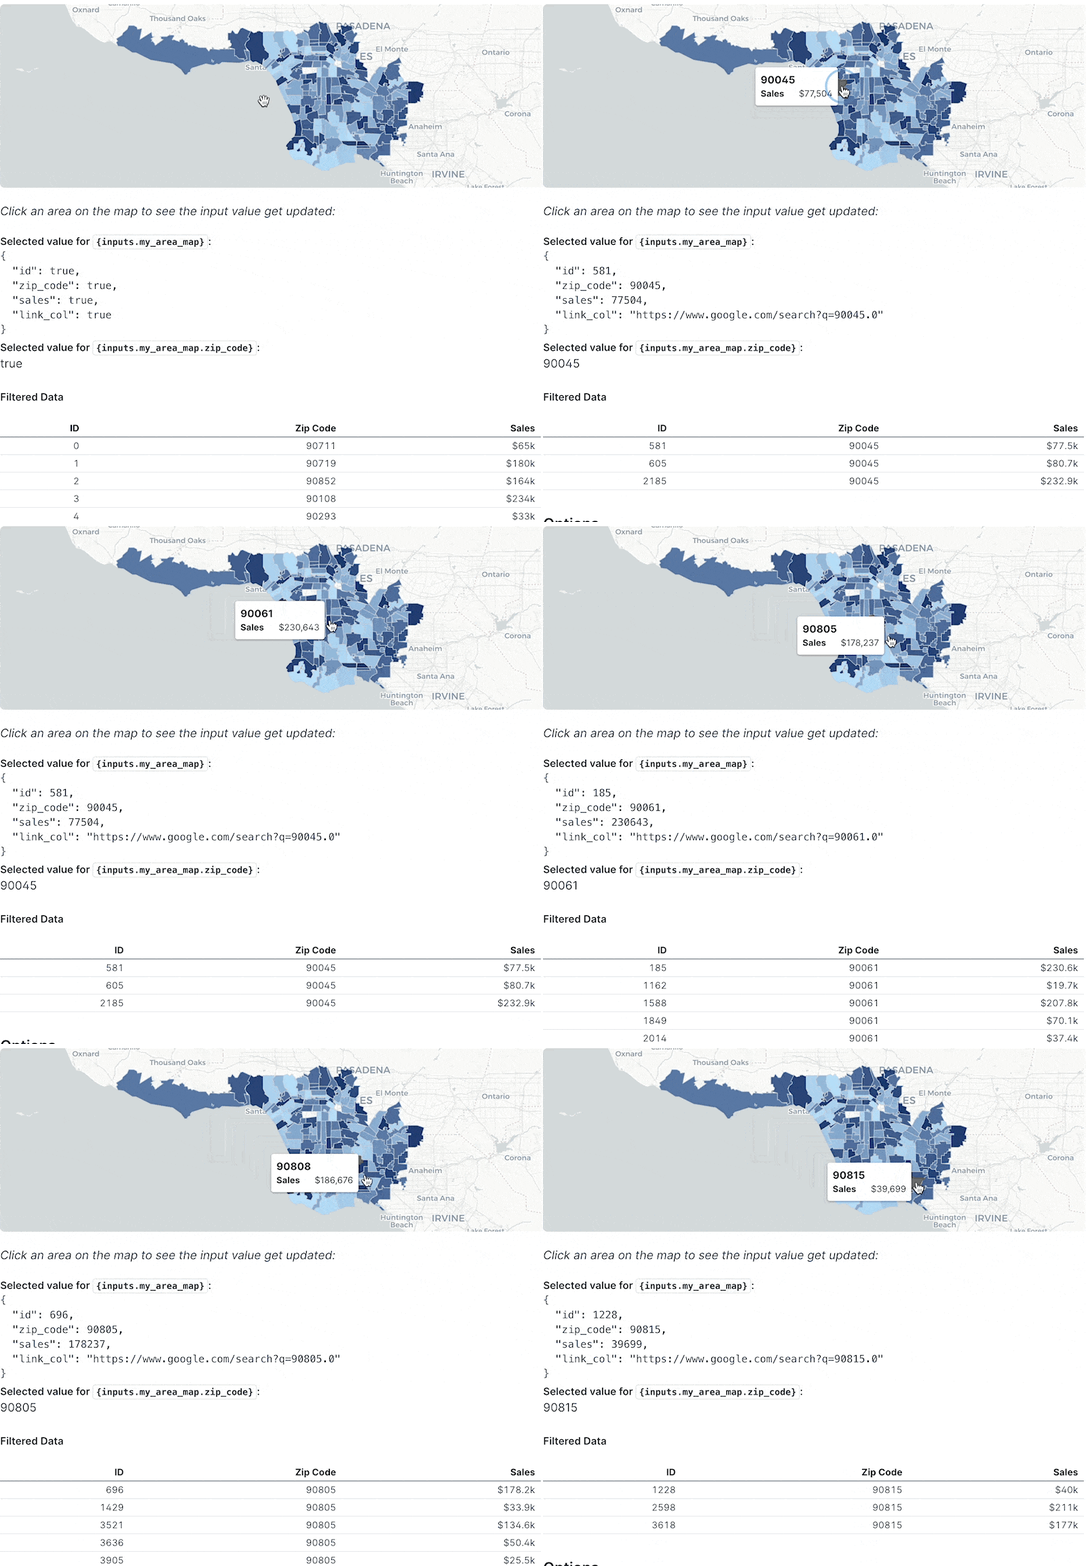
The maps we’re launching today can be used as inputs - they take a user’s selection and make it accessible as an input variable, which you can use to filter SQL queries on your page.
All you need to do is give each map a name, and when your user clicks a point or area on the map, an input variable will get created with the values for that specific point.
The input variable will have access to all the columns in the underlying query, so you can choose a specific column when referencing the variable in your SQL (e.g., ${inputs.my_map_name.column_to_use})
Drill-down Links
You can also create drill-down paths for your users to follow by including a link column in your map. When a user clicks an area or point on the map, they’ll automatically navigate to the URL defined in that column.
When combined with templated pages, this is great for creating multi-layered drill paths - e.g., drilling from region to state to county.
Custom Styling
Customizable Color Palettes
Use the colorPalette option to supply your own colors to a map’s color scale.
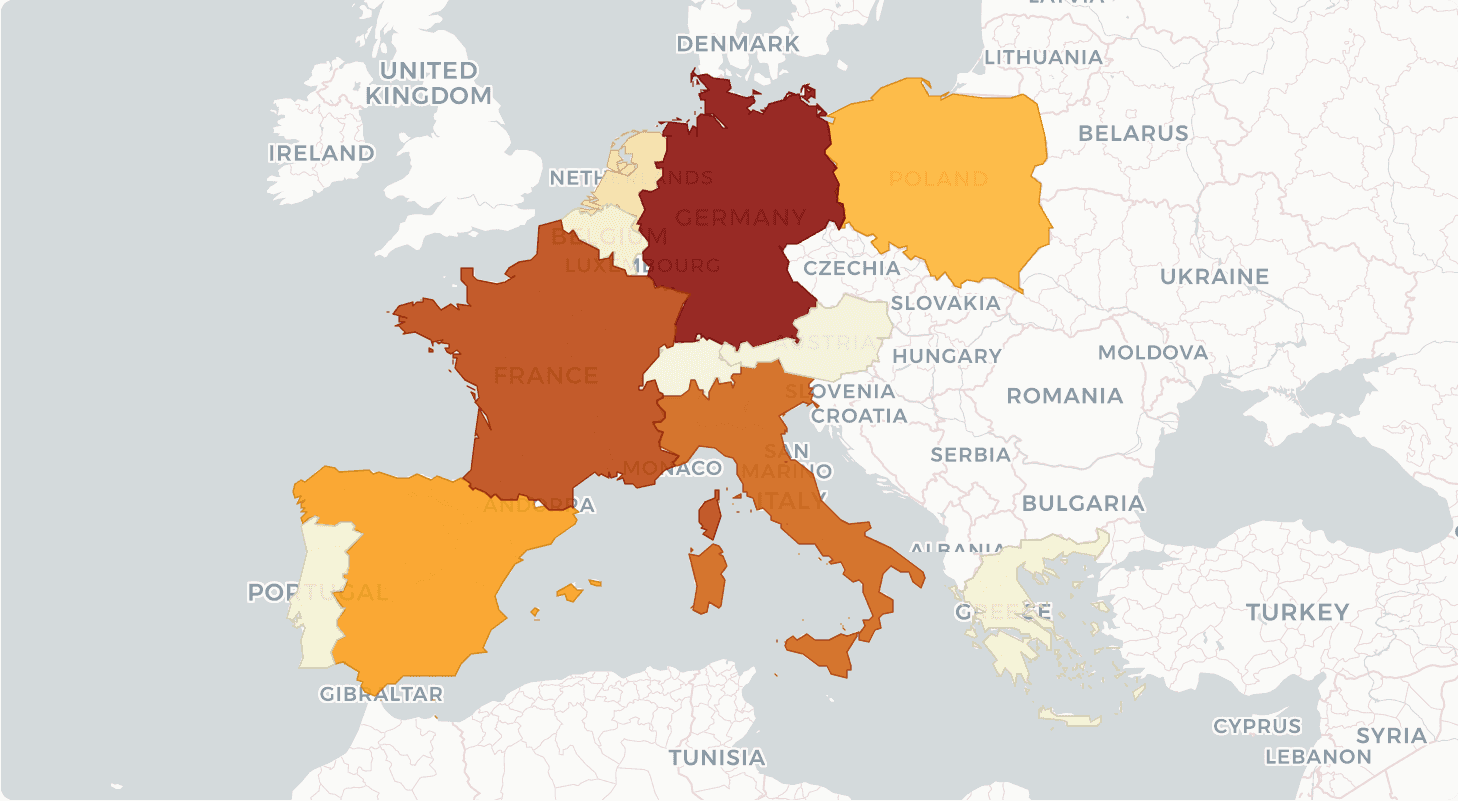 You also have control over other visual elements in the chart, including border width/color and opacity:
Customizable Tooltips
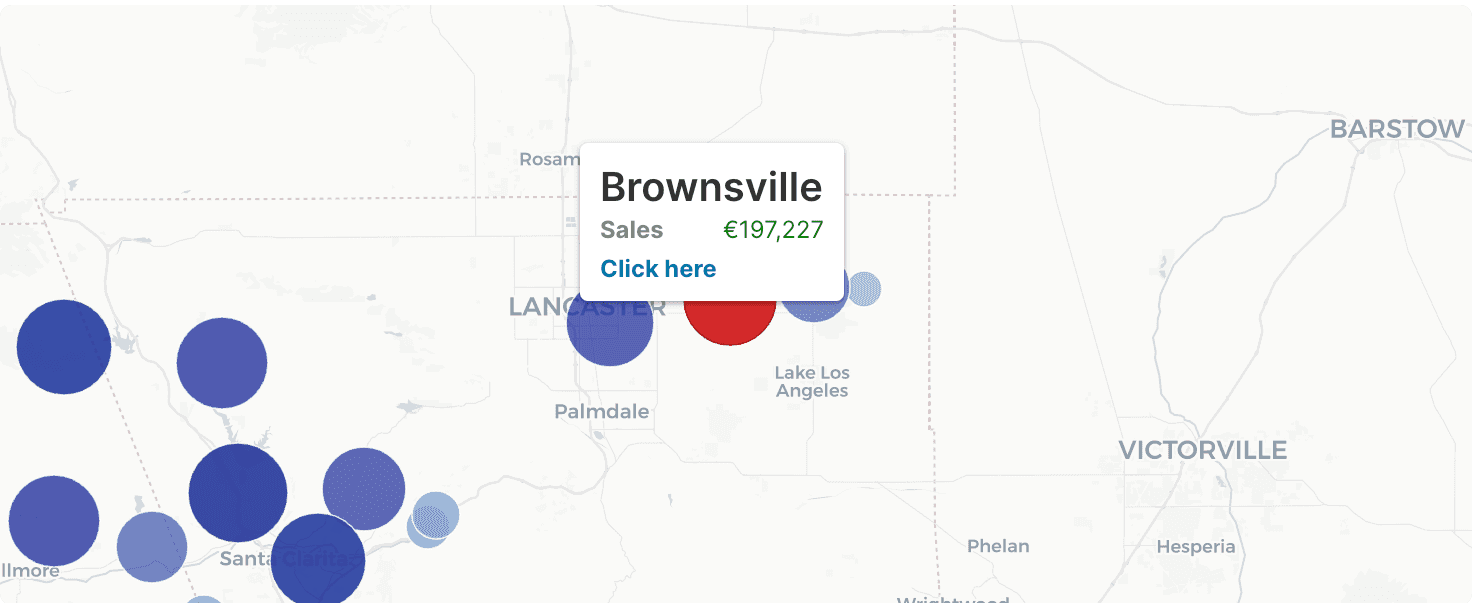
Create custom tooltips with the tooltip option, where you can pass in a list of columns and the formatting/styling you’d like to use for each - including links.
Tooltips also include fieldClass and valueClass variables, which allow you to include custom styling (using Tailwind classes), offering almost unlimited customization.
Customizable Base Layers
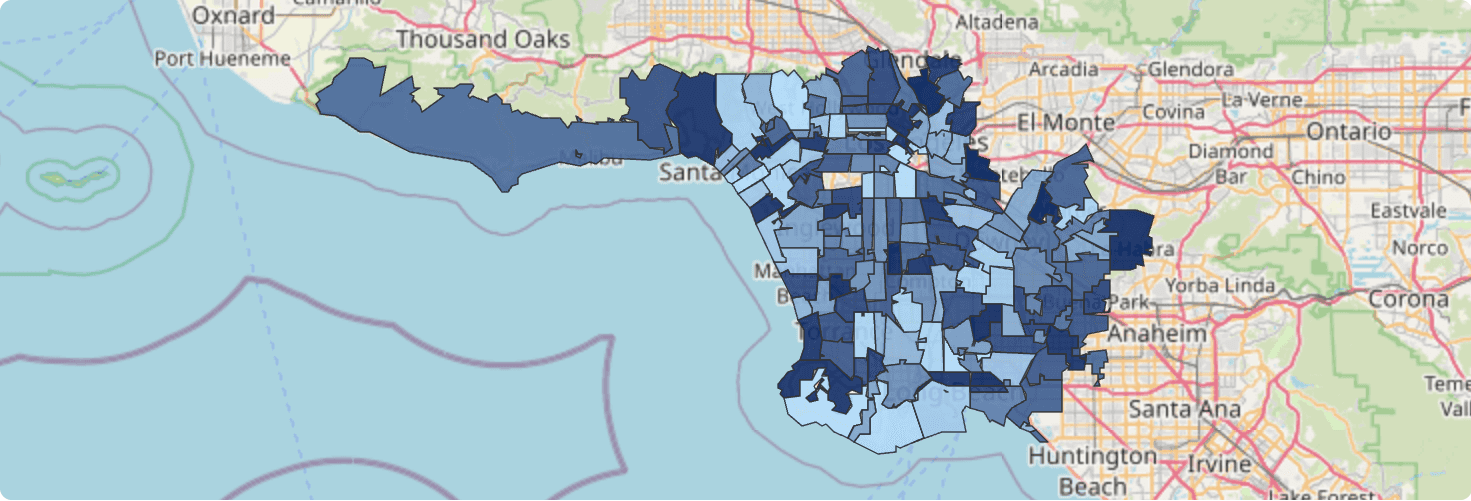
Override the basemap layer using the basemap option, which accepts a URL to a tile basemap. If you have a custom basemap you’ve created in a platform like Mapbox, you can use that as well.
Coming Soon: More Interactivity
Stay tuned for updates as we continue to roll out the input and drill-down link features to the rest of the components in the visualization library.
Get started with maps in Evidence
We’re excited to see what you build with these maps.
Check out the docs for interactive examples or get started with an Evidence project here.
If you have questions or feedback, reach out in the Evidence community
