
Data Scientists: Are You Getting Paid Enough?

Fact: Theatrical makeup artists (at $124k) earn more than data scientists (at $109k) in the US (BLS). My take: A lot of data scientists are being underpaid.
I covered data engineering salaries before, but there is also a treasure trove of salary data on Reddit in r/DataScience, which I wanted to dig deeper into.
In 2019, 2020 and 2021 a post ran that looked like this:

And a typical comment looks like the below, which has a well structured data format:
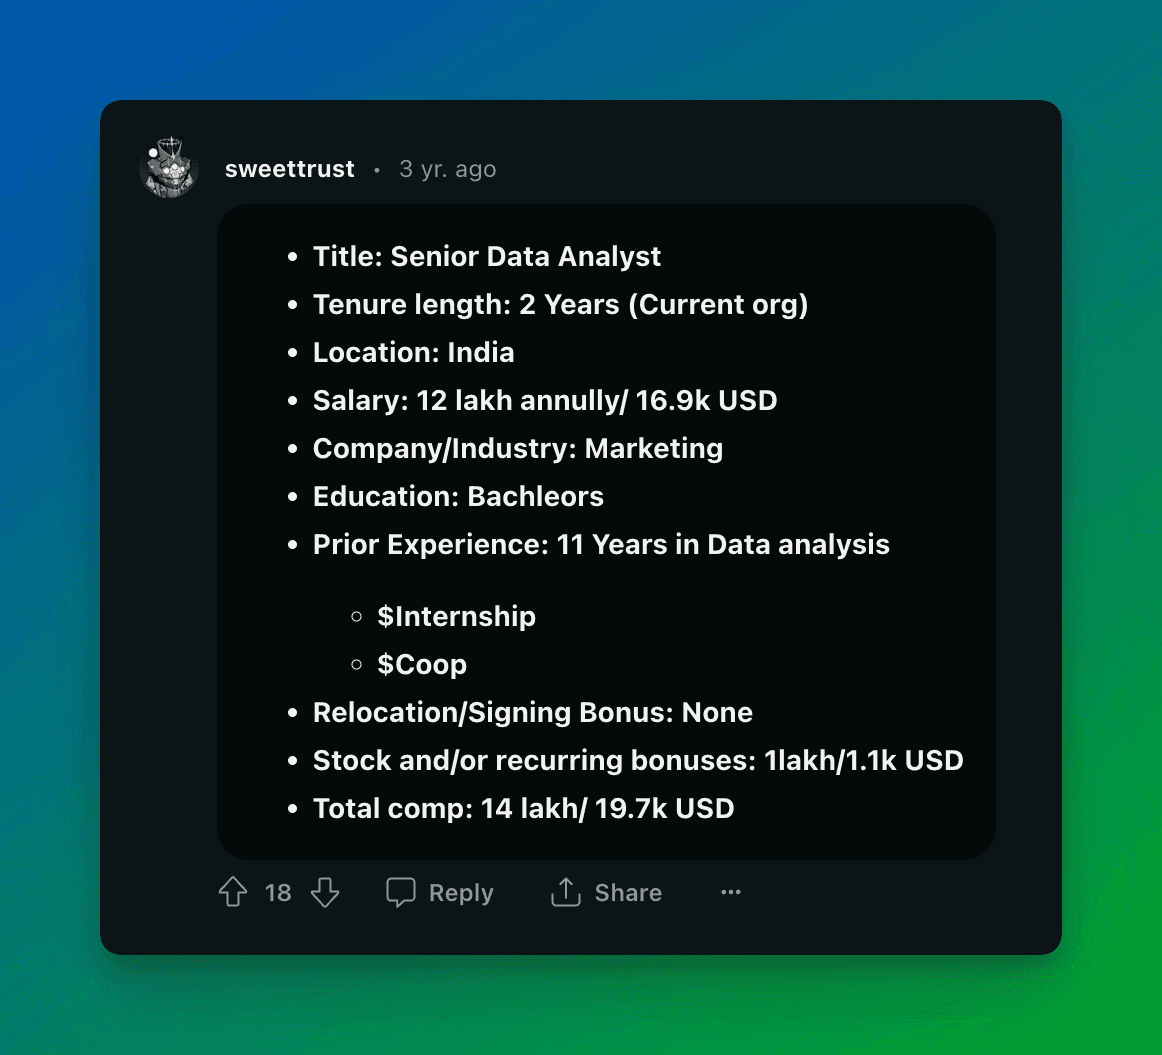
Which meant I’d be able to scrape the comment data and use it to build a nice table.
At this point, I should say that in a community full of data scientists, I’m not the first person to have this idea, and there are at least three other posts analyzing the data. However these scraped only a fraction of the total data, and I also thought there was a lot more insight to be had in the data if I got a bit creative.
Particularly I wanted to find out:
- How fast have data science salaries been increasing, given recent inflation?
- What’s the best way to increase your salary, if you’re willing to make active changes to do so?
The rough process I followed was:
- Extract the data from the Reddit comments
- Parse the data into a table so that I could easily analyze it
- Clean the data and tag it
- Analyze the data and present results
1. Extracting the data with DevTools
I used Chrome’s DevTools to find the requests that sent back comment data. It took a bit of searching, but eventually I found it.
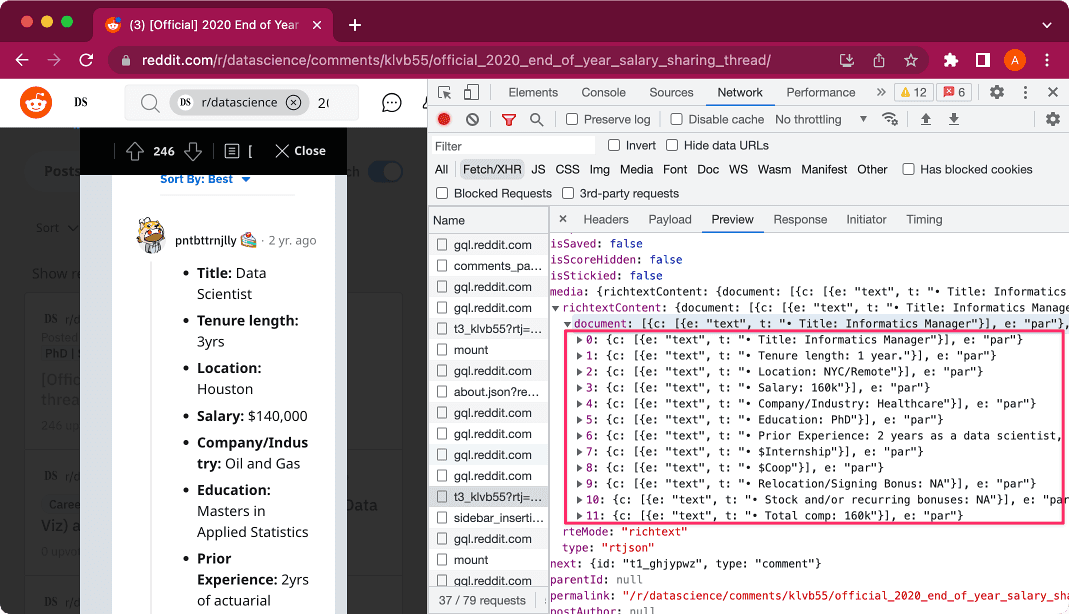
The requests sent back a data file in json format. For example:
{
    "account": null,
    "authorFlair": {...},
    "commentLists": {...},
    "comments": {
        "t1_ghe6iex": {
            ...
            "media": {
                "richtextContent": {
                    "document": [
                        {"c": [
                            {"c": [{"c": [{"e": "text","t": "Title: Data Scientist","f": [[1,0,6]]}],"e": "par"}],"e": "li"},
                            {"c": [{"c": [{"e": "text","t": "Tenure length: 3yrs","f": [[1,0,14]]}],"e": "par"}],"e": "li"},
                            {"c": [{"c": [{"e": "text","t": "Location: Houston","f": [[1,0,9]]}],"e": "par"}],"e": "li"},
                            {"c": [{"c": [{"e": "text","t": "Salary: $140,000","f": [[1,0,7]]}],"e": "par"}],"e": "li"},
                            {"c": [{"c": [{"e": "text","t": "Company/Industry: Oil and Gas","f": [[1,0,17]]}],"e": "par"}],"e": "li"},
                            {"c": [{"c": [{"e": "text","t": "Education: Masters in Applied Statistics","f": [[1,0,10]]}],"e": "par"}],"e": "li"},
                            {"c": [{"c": [{"e": "text","t": "Prior Experience: 2yrs of actuarial experience","f": [[1,0,17]]}],"e": "par"}],"e": "li"},
                            {"c": [{"c": [{"e": "text","t": "Relocation/Signing Bonus: $15,000 signing bonus","f": [[1,0,25]]}],"e": "par"}],"e": "li"},
                            {"c": [{"c": [{"e": "text","t": "Stock and/or recurring bonuses: 15-30% bonus(no bonus this year of course due to Covid)","f": [[1,0,31]]}],"e": "par"}],"e": "li"},
                            {"c": [{"c": [{"e": "text","t": "Total comp: $140,000","f": [[1,0,11]]}],"e": "par"}],"e": "li"}],"e": "list","o": false},
                            {"c": [{"e": "text","t": "I'm about to accept a new job that will be include a nice paycut (125K) just to get out of O&G.The industry is on a downturn and I think now is a good time move on.The premium pay is no longer worth the instability."}],"e": "par"}
                    ]
                },
                "type": "rtjson",
                "rteMode": "richtext"
            },
            "profileImage": "https://styles.redditmedia.com/t5_mb2hi/styles/profileIcon_snoo1ac41e44-c7ed-4194-9f09-48672b506ee0-headshot.png?width=256&height=256&crop=256:256,smart&s=0e6131dfcf0c758d2c28fb08b8dbae7ebf688161"
        },
        // & MANY MORE COMMENTS
    }
}
Reddit “lazy loads” - it doesn’t show all the comments until you scroll down. So I scrolled until all the comments were loaded, and grabbed the data from all the requests. There were three requests with data per yearly thread: nine in all.
2. Parsing the data into a table with Python
Not every poster is kind enough to conform rigidly to the above format. Some didn’t include all of the fields, or didn’t break lines after each field:
This meant I needed a couple of different approaches to parse the data. So I opened a Jupyter notebook, and wrote a few lines of python to parse the json files.
import json
import pandas as pd

# run it for each post file
dates=['2021','2020','2019']
pages=['1','2','3']
array = []

for page in pages:
    for date in dates:
        with open(date + '_' + page + '_post.json', 'r') as f:
            data = json.load(f)
            comment_no = 0
            for key in data:
                if key == "comments":
                    for comment in data[key]:
                        row=[]
                        row.append(date)
                        row.append(page)
                        for i in range(0,11):
                            # if the data is in a bulleted list, this works
                            try:
                                value=data[key][comment]['media']["richtextContent"]["document"][0]['c'][i]['c'][0]['c'][0]['t']
                                # Strips out some optional fields, which otherwise disrupt the columns
                                if "Remote:" not in value:
                                    if "Internship:" not in value:
                                        if "Details:" not in value:
                                            row.append(value)
                            except:
                                # if the data is in a list, but has a non-list sentence first. (Posters often add a preamble)
                                try:
                                    value=data[key][comment]['media']["richtextContent"]["document"][1]['c'][i]['c'][0]['c'][0]['t']
                                    if "Remote:" not in value:
                                        if "Internship:" not in value:
                                            if "Details:" not in value:
                                                row.append(value)

                                except:
                                    try:
                                        # this works if the data is not in a list
                                        value=data[key][comment]['media']["richtextContent"]["document"][i]['c'][0]['t']
                                        if "Remote:" not in value:
                                            if "Internship:" not in value:
                                                if "Details:" not in value:
                                                    row.append(value)
                                    except:
                                        pass
                        # remove results with less than 6 lines - these tend to be comments that do not contain salary data (which have 8-10 lines)
                        if len(row)>5:
                            array.append(row)
                        comment_no += 1

df=pd.DataFrame(array)
df.columns=['date','page','title','tenure','location','salary','industry','education', 'prior_experience','signing_bonus','stock_or_bonus','total_comp', 'extra_col']
df.to_csv('salary_data.csv', index=False)
select
date as date_yyyy,
title,
tenure,
location,
salary,
industry,
education,
prior_experience,
signing_bonus,
stock_or_bonus,
total_comp
from ds_salary_data_raw
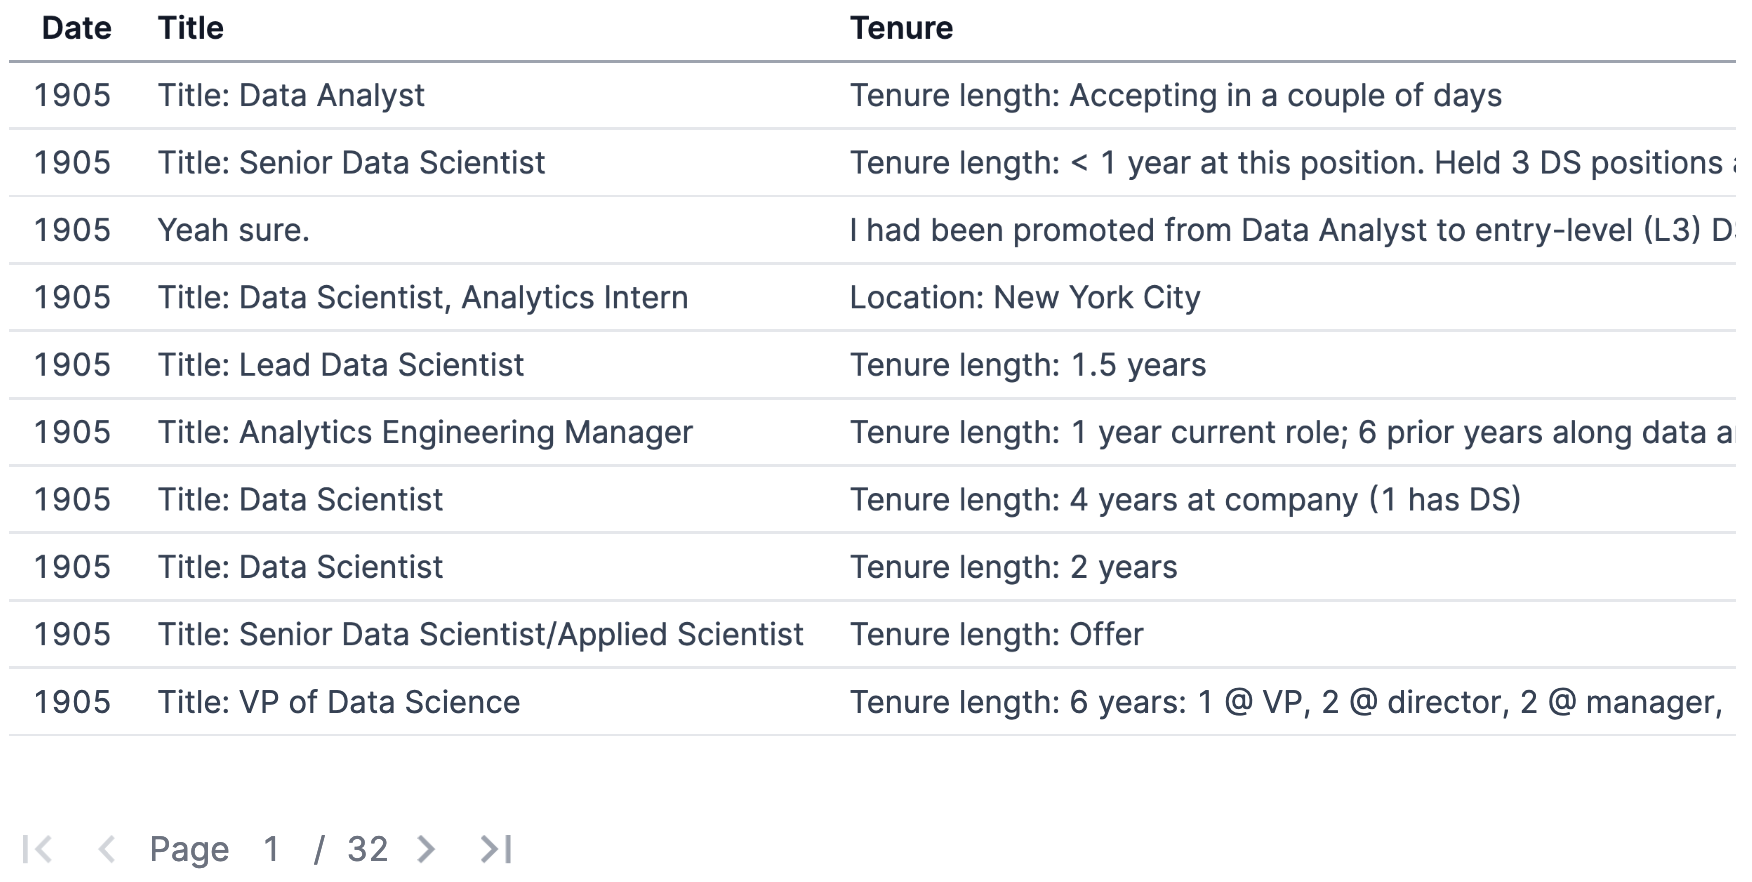
order by date descHaving run this, I have a table of 311 rows of data. But it was a bit of a mess, with issues including:
- Duplicate rows
- Rows with non-salary data comments
- Rows with misaligned columns
On top of this, the columns mainly contain free-text. E.g. the salaries are in different formats, and different currencies.
3. Data cleaning
I re-used some of my code from cleaning data engineering salary posts, but for some of the columns I had to do some extra work. The aim of the cleaning was:
- Extract continuous data columns (salary, tenure): extract the numbers, detect and standardize the units (USD, years of tenure)
- Group categorical data columns (title, location, industry, education): try to categorize the responses into a manageable number of groups
- Remove erroneous and duplicate rows
For most of the cleaning I used a pretty rule based approach.
E.g. if salary contains k, multiply by 1000, if salary contains EUR, multiply by the EUR-USD FX rate, etc.
However, there were two columns where categorizing was pretty hard: location, and industry. So I enlisted my friend AI.
3.1 Using OpenAI to clean location data
I began by using a rule-based approach to categorize countries, but it turns out almost all the data is from the US.
Instead I decided to compare the different regions in the US. But the raw data has a real mix of place hierarchies, which makes a rule based approach arduous.
select location
from ds_salary_data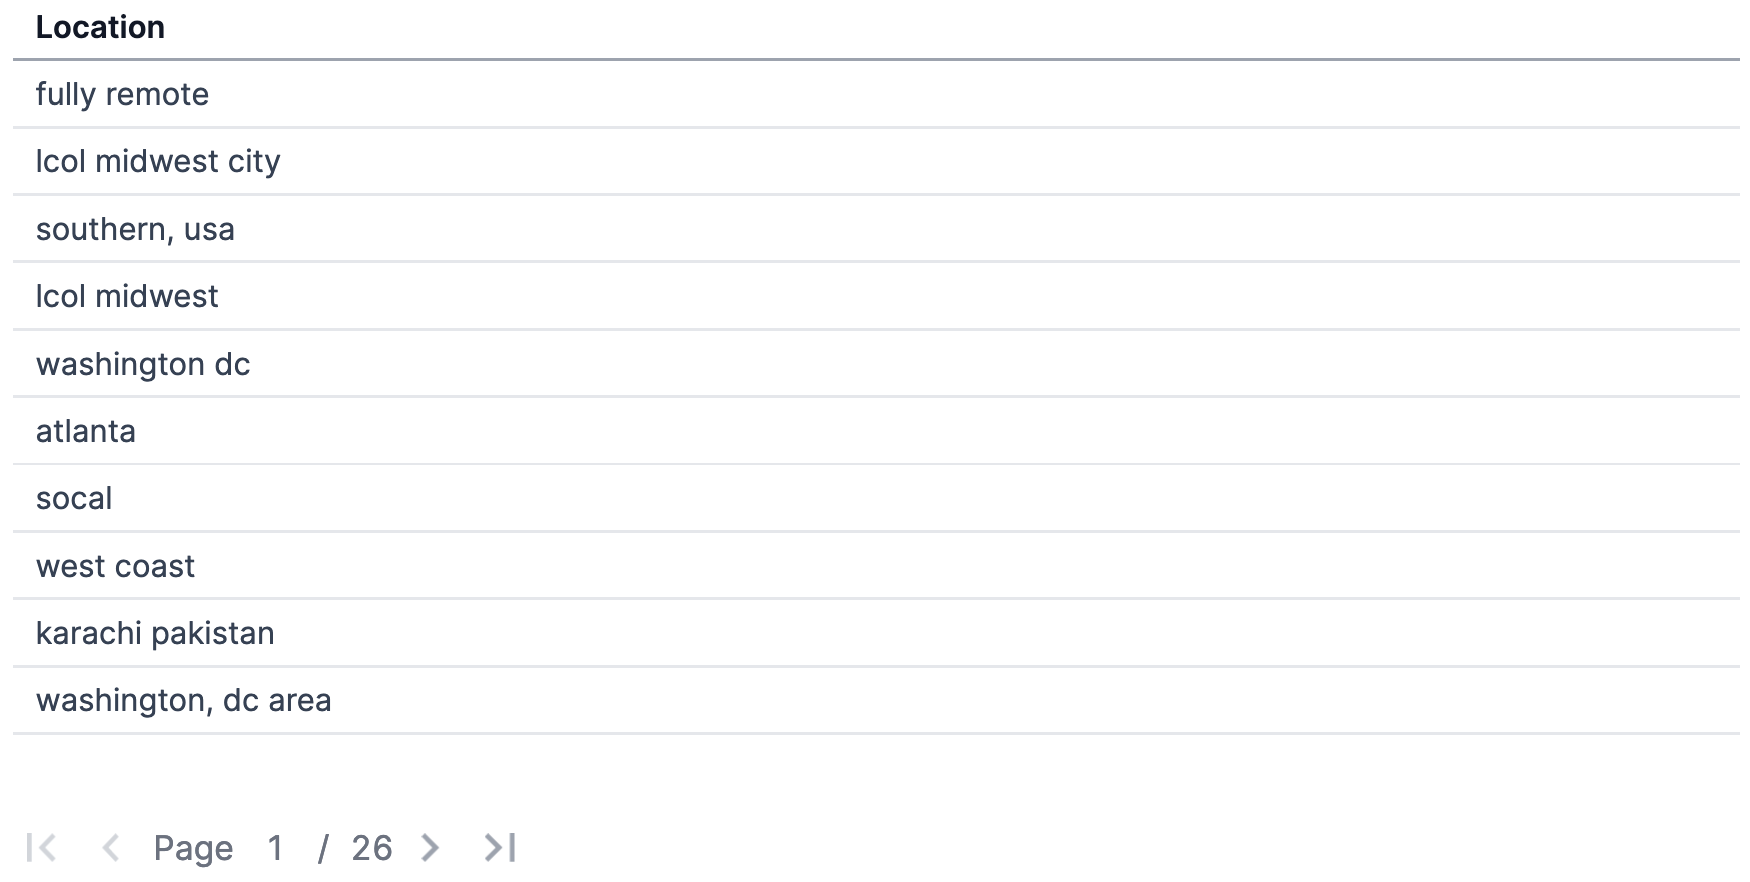
I’m not a ML engineer, so I wasn’t going to write my own model. However, OpenAI has a classifier model(free account needed) I used for this. It’s pretty remarkable - you just pass it some text, and it autocompletes it for you.
I passed it the following:
The following is a list of places in the US

lcol midwest city
southern, usa
midwest
washington dc
atlanta
socal
karachi pakistan
west coast
....


The following is a list of regions they fit into:

Midwest
Northeast
Southeast
Southwest
West coast
Unspecified
Non-US


lcol midwest city - Midwest;You click the Submit button in the UI and voila, it autocompletes it for you based on the instructions you gave it:
lcol midwest city - Midwest;
southern, usa - Southeast;
midwest - Midwest;
washington dc - Northeast;
atlanta - Southeast;
socal - Southwest;
karachi pakistan - Non-US;
west coast - West coast;
...Pretty cool given how little we tell it about the data. Above you can see it correctly classifies Karachi, Pakistan as Non-US.
I then used the output to map into the original data.
After all the cleaning, it’s not perfect, but it’s pretty good:
select date, title, tenure, tenure_clean, location, us_region, salary, salary_usd, industry, industry_group, education, education_level
from ds_salary_data

order by date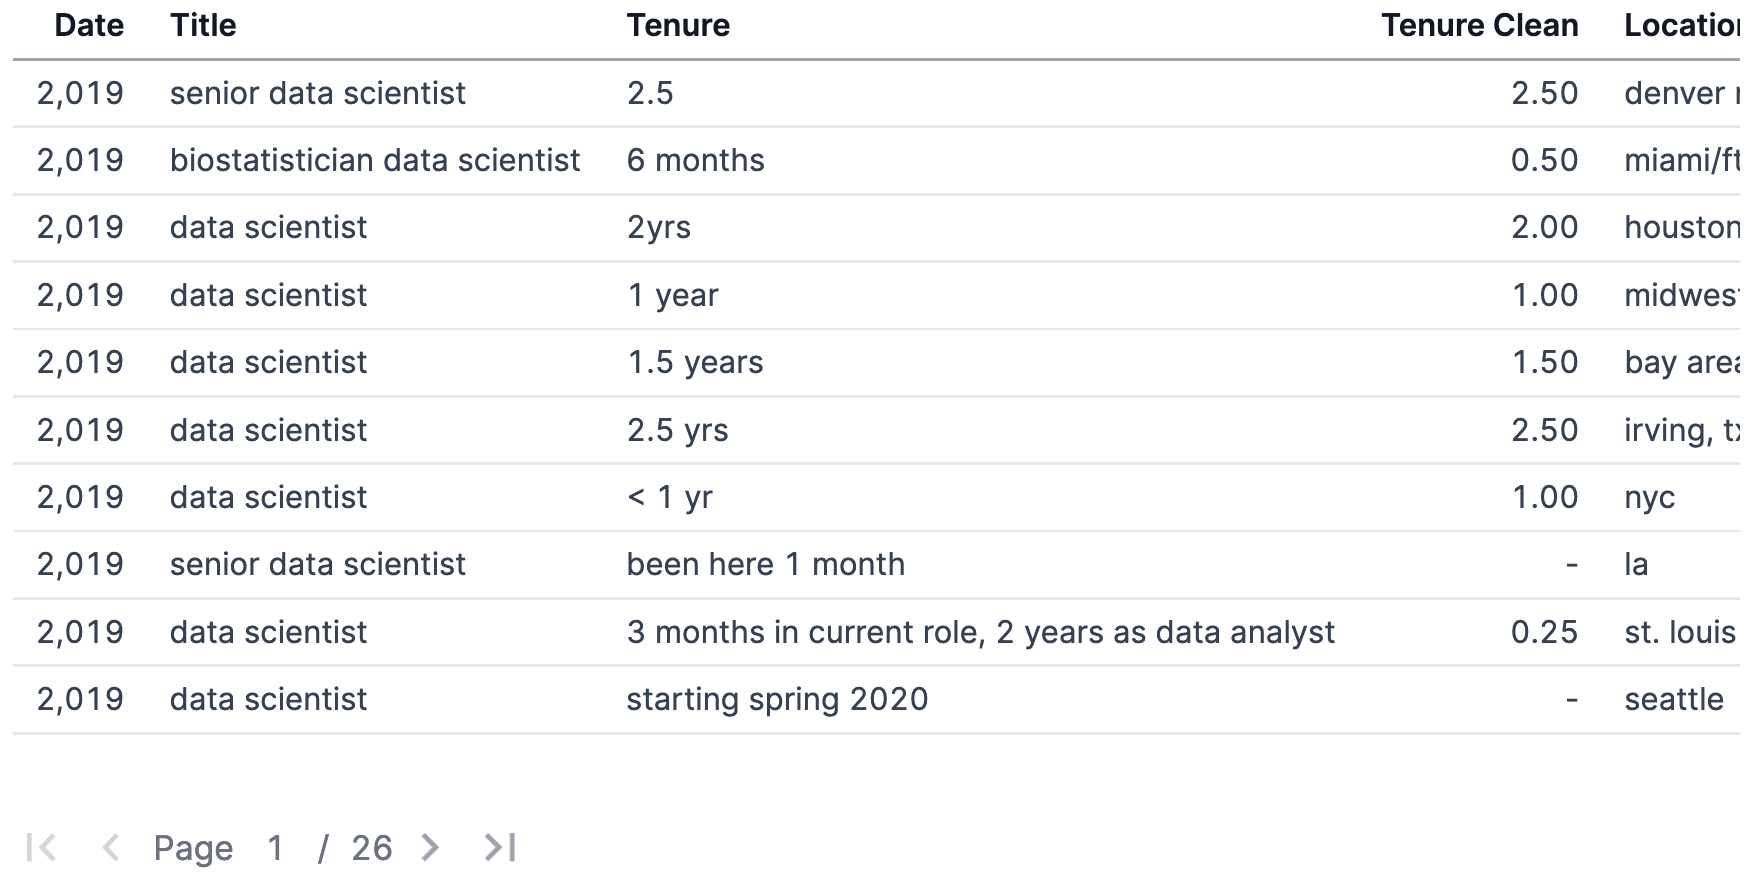
4. Analyze the data
This whole article is written using Evidence, including for the charts. It’s a great alternative to BI tools for analyzing and presenting data when you want to add narrative (Disclosure: I work there).
4.1 Commenters are mostly highly educated and US-based
I started by exploring who our commenters were.
with all_titles as(
select
title,
count(*) as responses,
ROW_NUMBER () OVER ( ORDER BY count(*) desc ) row_num
from ds_salary_data
group by title
order by responses desc)

select
'   Job Title' as x,
case
        when row_num <= 10 then title
        else 'all other' end as title_group,
sum(responses) as num_responses,
sum(row_num) as row_num
from all_titles
group by title_group
order by row_num
with all_ind as(
select
industry_group,
count(*) as responses,
median(salary_usd) as med_salary_usd0k,
ROW_NUMBER () OVER ( ORDER BY count(*) desc ) row_num
from ds_salary_data
group by industry_group
order by responses desc)
select
' Industry' as x,
case
when row_num <= 10 then industry_group
else 'all other' end as industry_category,
round(sum(responses*med_salary_usd0k) /sum(responses)) as group_med_salary_usd0k,
sum(responses) as num_responses,
sum(row_num) as row_num
from all_ind
group by industry_category
order by row_numselect
'Education' as x,
case
when education_level is not null then education_level
else '(Not specified)' end as education_level,
count(*) as num_responses
from ds_salary_data
group by education_levelselect
'US Region' as x,
case
when us_region ilike 'unspecified' then 'Unspecified US'
else us_region end as us_region,
count(*) as num_responses
from ds_salary_data
group by us_region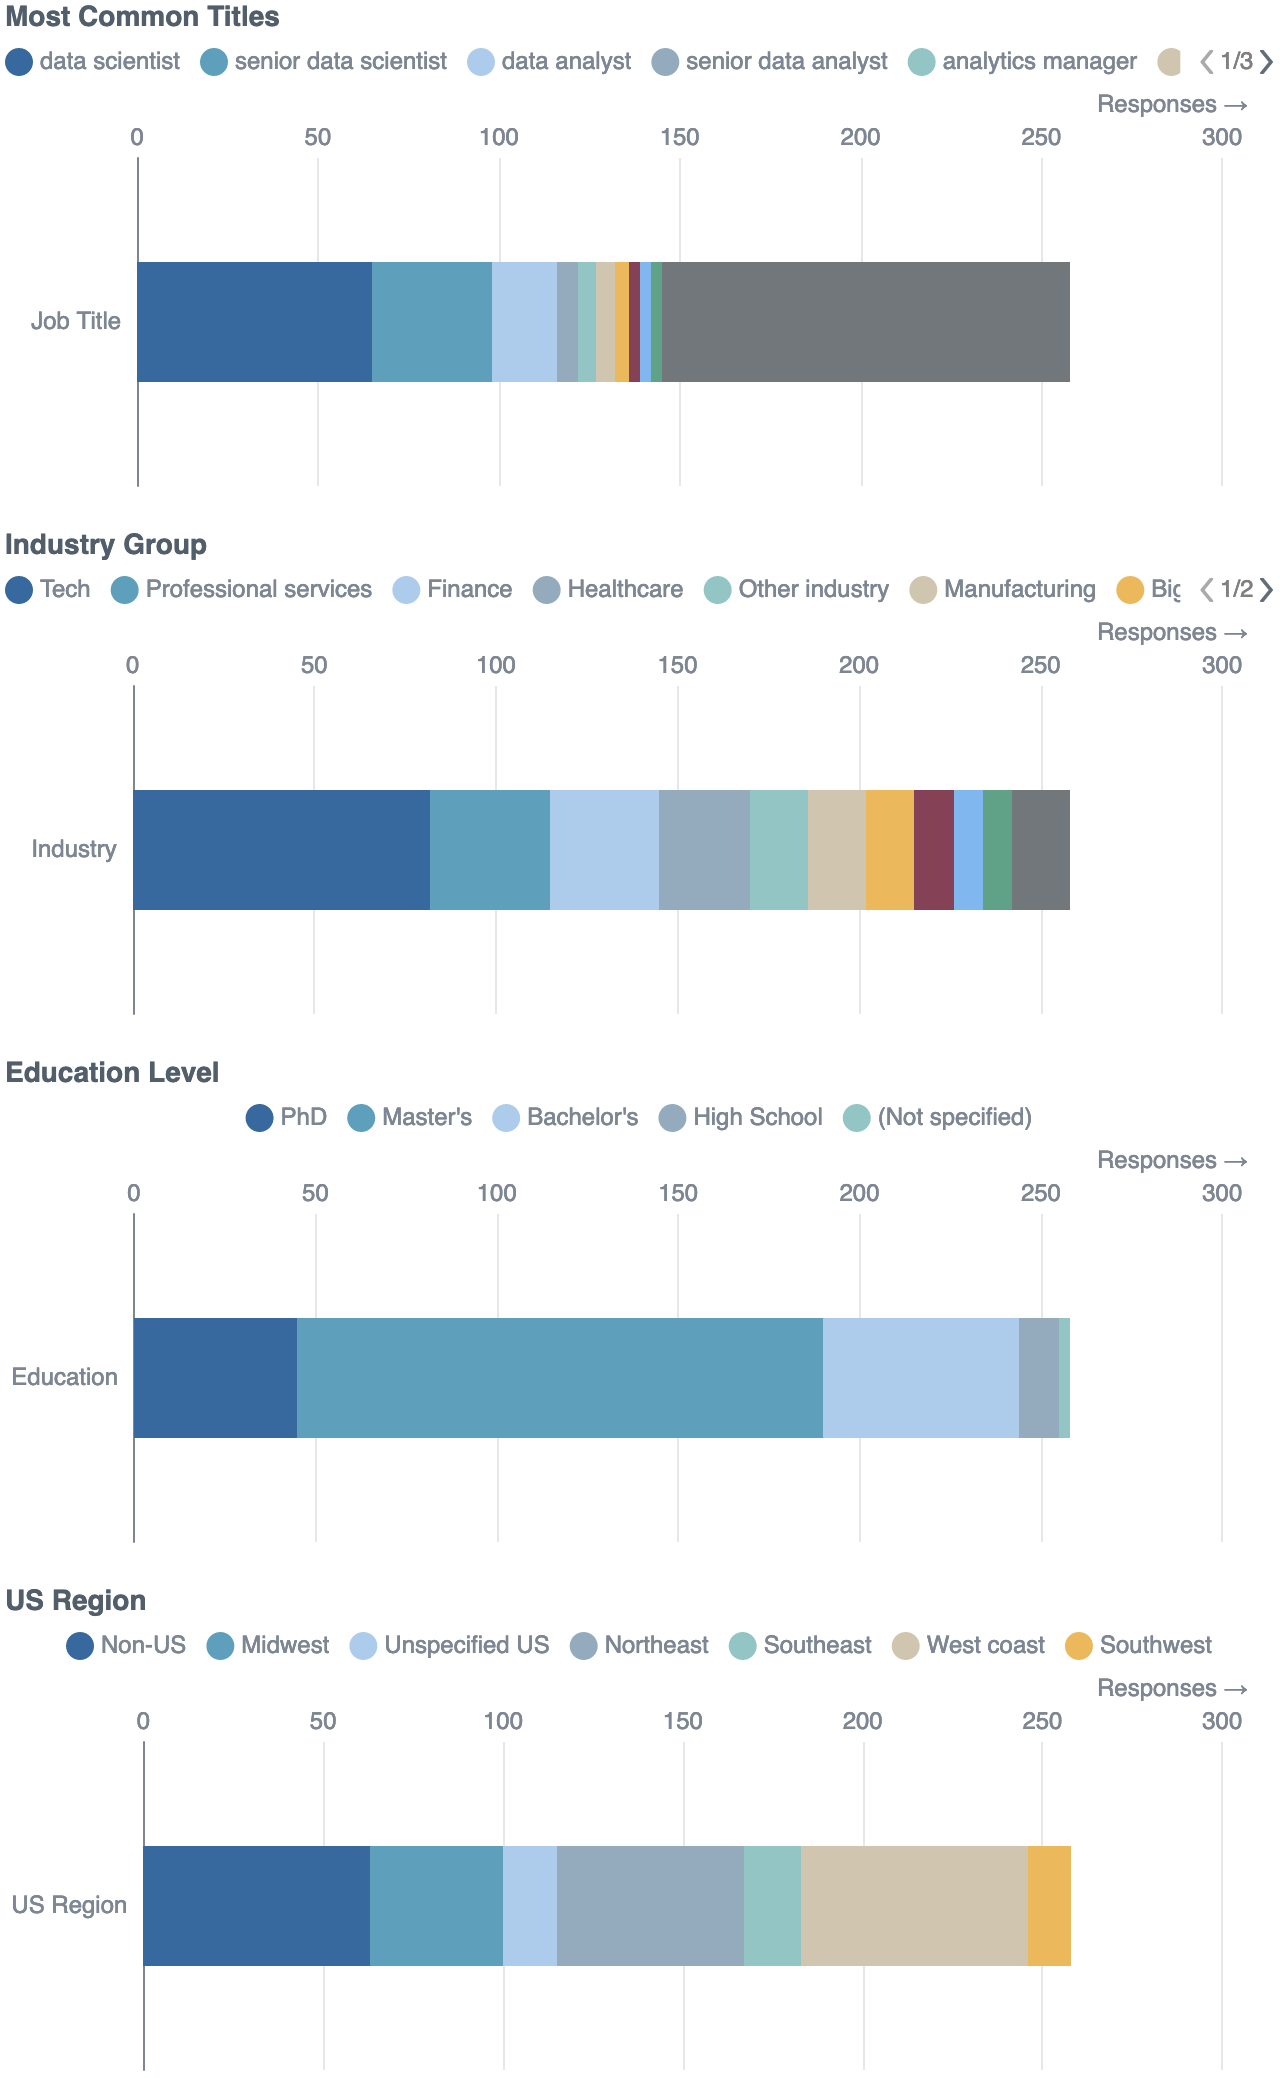
As may surprise no one, data scientists are pretty educated: Over 50% have either a Master’s or a PhD.
Also, roughly 75% of the responses are from the US, with most from the West and Northeast.
4.2 Average data science salaries & experience
Histograms are generally a good fit for displaying continuous data.
SELECT
round(AVG(salary_usd)) as avg_usd0k,
round(median(salary_usd)) as med_usd0k
FROM ds_salary_data
select
floor(salary_usd/10000.00)*10000 as bin_floor_usd0k,
count(*) as responses
from ds_salary_data
group by bin_floor_usd0k
order by bin_floor_usd0k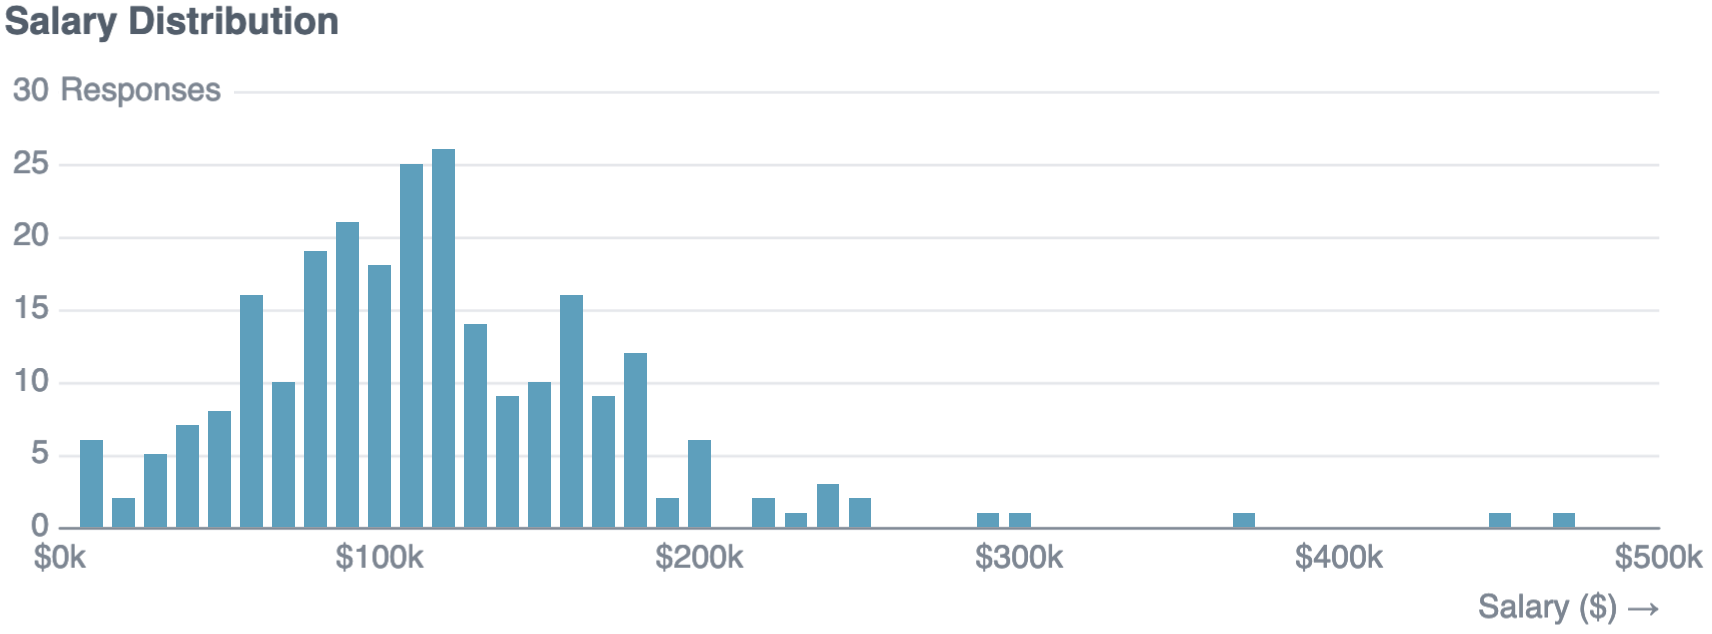
The median data science salary is $115k. Dragged up by a few high values in the dataset, the mean salary is $120k.
select
avg(tenure_clean)
from ds_salary_data
select
--round up to nearest whole year
ceil(tenure_clean) as years_experience_rounded,
count(*)
from ds_salary_data
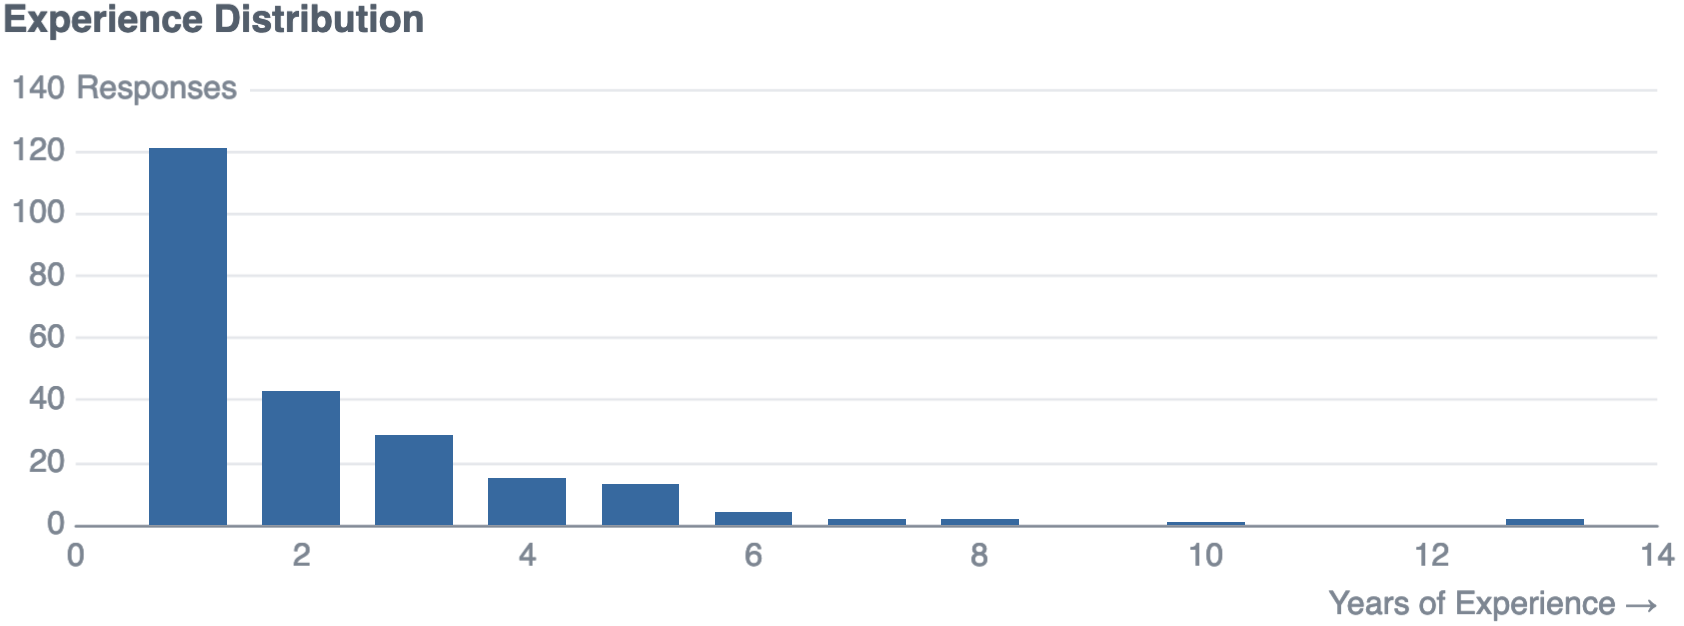
group by years_experience_roundedThe average data scientist in the dataset has 1.94 years of experience, with almost half of posts from those with 1 year of experience or less: This data set is a reasonably junior sample.
4.3 Data science salaries are increasing
I looked at the trend of median, 25th percentile and 75th percentile salaries over time.
select
date::string as year,
round(percentile_cont(0.25) within group (order by salary_usd)) as percentile_25_usd0k,
round(median(salary_usd)) as median_usd0k,
round(percentile_cont(0.75) within group (order by salary_usd)) as percentile_75_usd0k
from ds_salary_data
group by date
order by date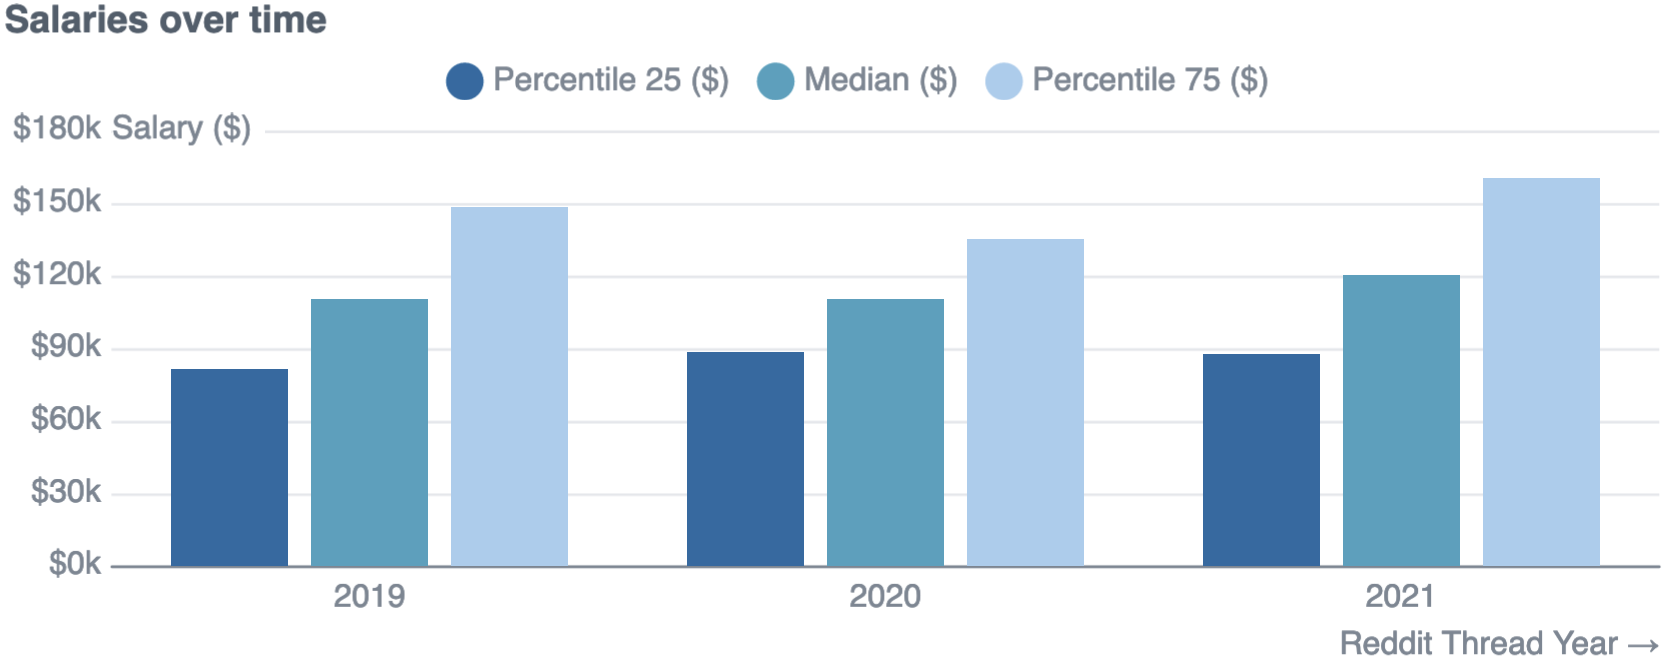
The median, 25th and 75th percentiles salaries have all increased between the 2019 and 2021 threads:
- 25th percentile from $82k to $87k (+7%)
- Median salary from $110k to $120k (+9%)
- 75th percentile from $148k to $160k (+8%)
However, it is not a totally smooth trend (e.g. the 75th percentile in 2020 was lower than in 2019). Relatively small sample sizes might be causing noise here.
4.4 Gaining experience quickly boosts your comp
The most passive way to increase your salary would be to just keep working to gain experience. Let’s look at how median salaries change with tenure:
select
median(salary_usd) as med_salary_usd0k,
ceil(tenure_clean) as years_experience_rounded,
count(*) as num_responses
from ds_salary_data
group by years_experience_rounded
order by years_experience_rounded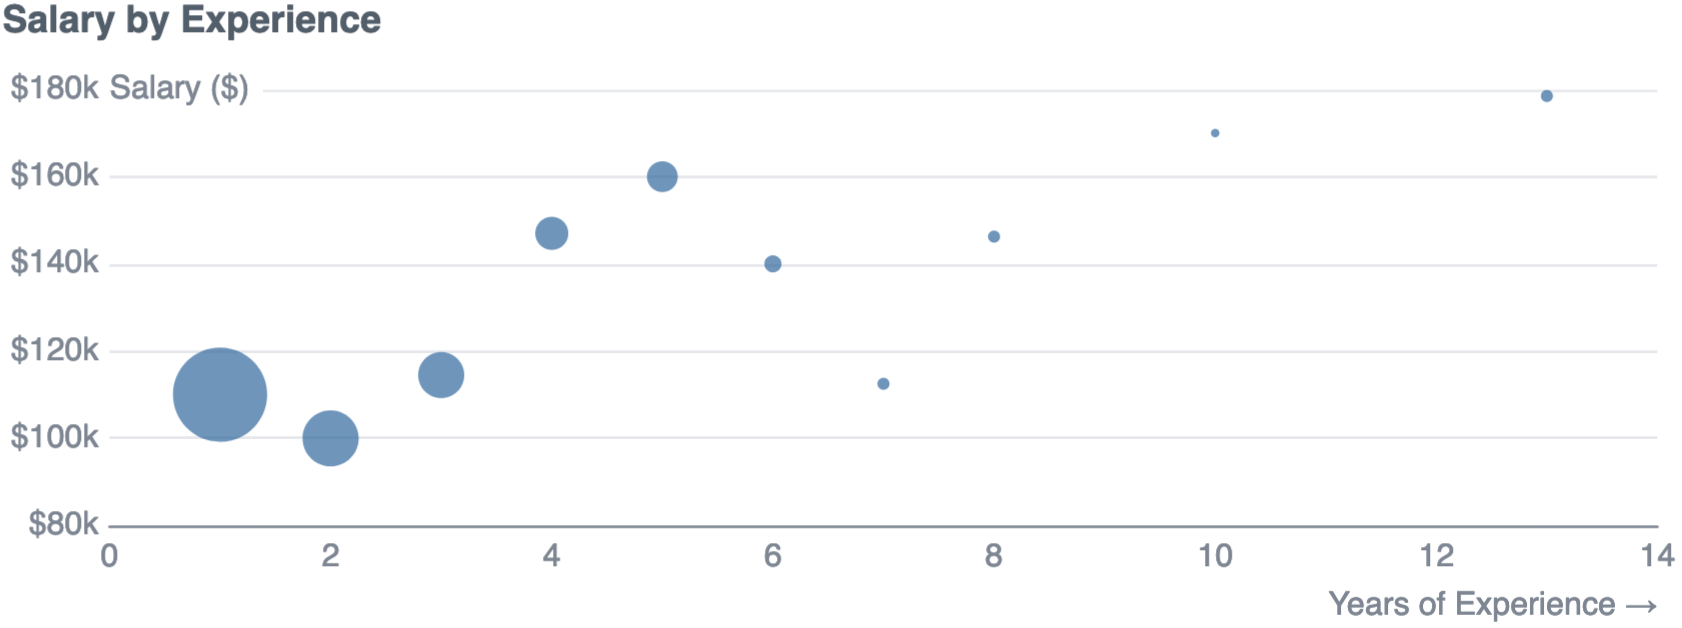
In the first 5 years, salaries increase from $110k to $160k. After this, the sample size is much smaller, but it appears to flatten off.
4.5 Going back to school increases your salary
People often go back to college during an economic downturn, as there are less opportunities in the job market. But there’s a debate about whether further degrees are really worth it. Is it really worth doing a Master’s or PhD?
select
median(salary_usd) as med_salary_usd0k,
education_level,
count(*) as num_responses
from ds_salary_data
where education_level is not null
group by education_level
order by med_salary_usd0k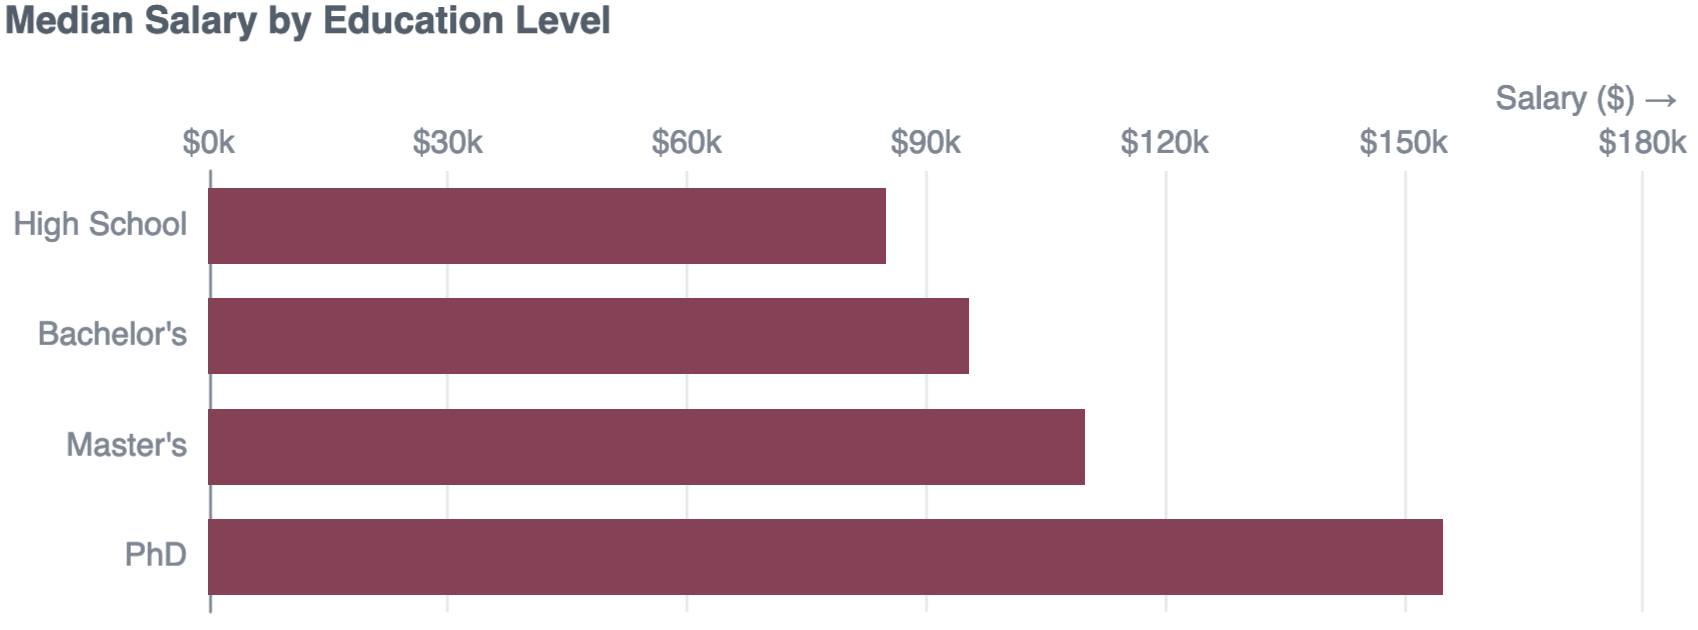
In data science at least, higher levels of education are correlated with higher salaries. Earning a Master’s could net you +$15k salary on a Bachelor’s, while upgrading a Master’s to a PhD could be worth +$45k a year.
4.6 Relocating could get you pay-rise
Salaries across the US are different. Where is it most lucrative to work?
select
median(salary_usd) as med_salary_usd0k,
us_region,
count(*) as num_responses
from ds_salary_data
group by us_region
order by med_salary_usd0k desc
Unsurprisingly, the West (which includes the bay area) is the area with the highest salaries.
However, even without moving to the West coast you can change your salary significantly by relocating. Those in the Southeast could get a $20k raise if they relocated to the Northeast, Southwest or Midwest.
4.7 Changing industry may get you a bigger paycheck
Another way to increase your salary is to change jobs. But what kind of company should you target?
with all_ind as (
    select
    median(salary_usd) as med_salary_usd0k,
    industry_group,
    count(*) as responses,
    ROW_NUMBER () OVER ( ORDER BY  median(salary_usd) desc ) row_num
    from ds_salary_data
    group by industry_group)

select
    round(sum(responses*med_salary_usd0k) /sum(responses)) as med_salary_usd0k,
    case
        when industry_group ilike '%other%' then 'Other'
        when responses < 6 then 'Other'
        else industry_group
        end as industry,
    sum(responses) as num_responses,
    sum(row_num) as row_num
from all_ind
group by industry
order by row_num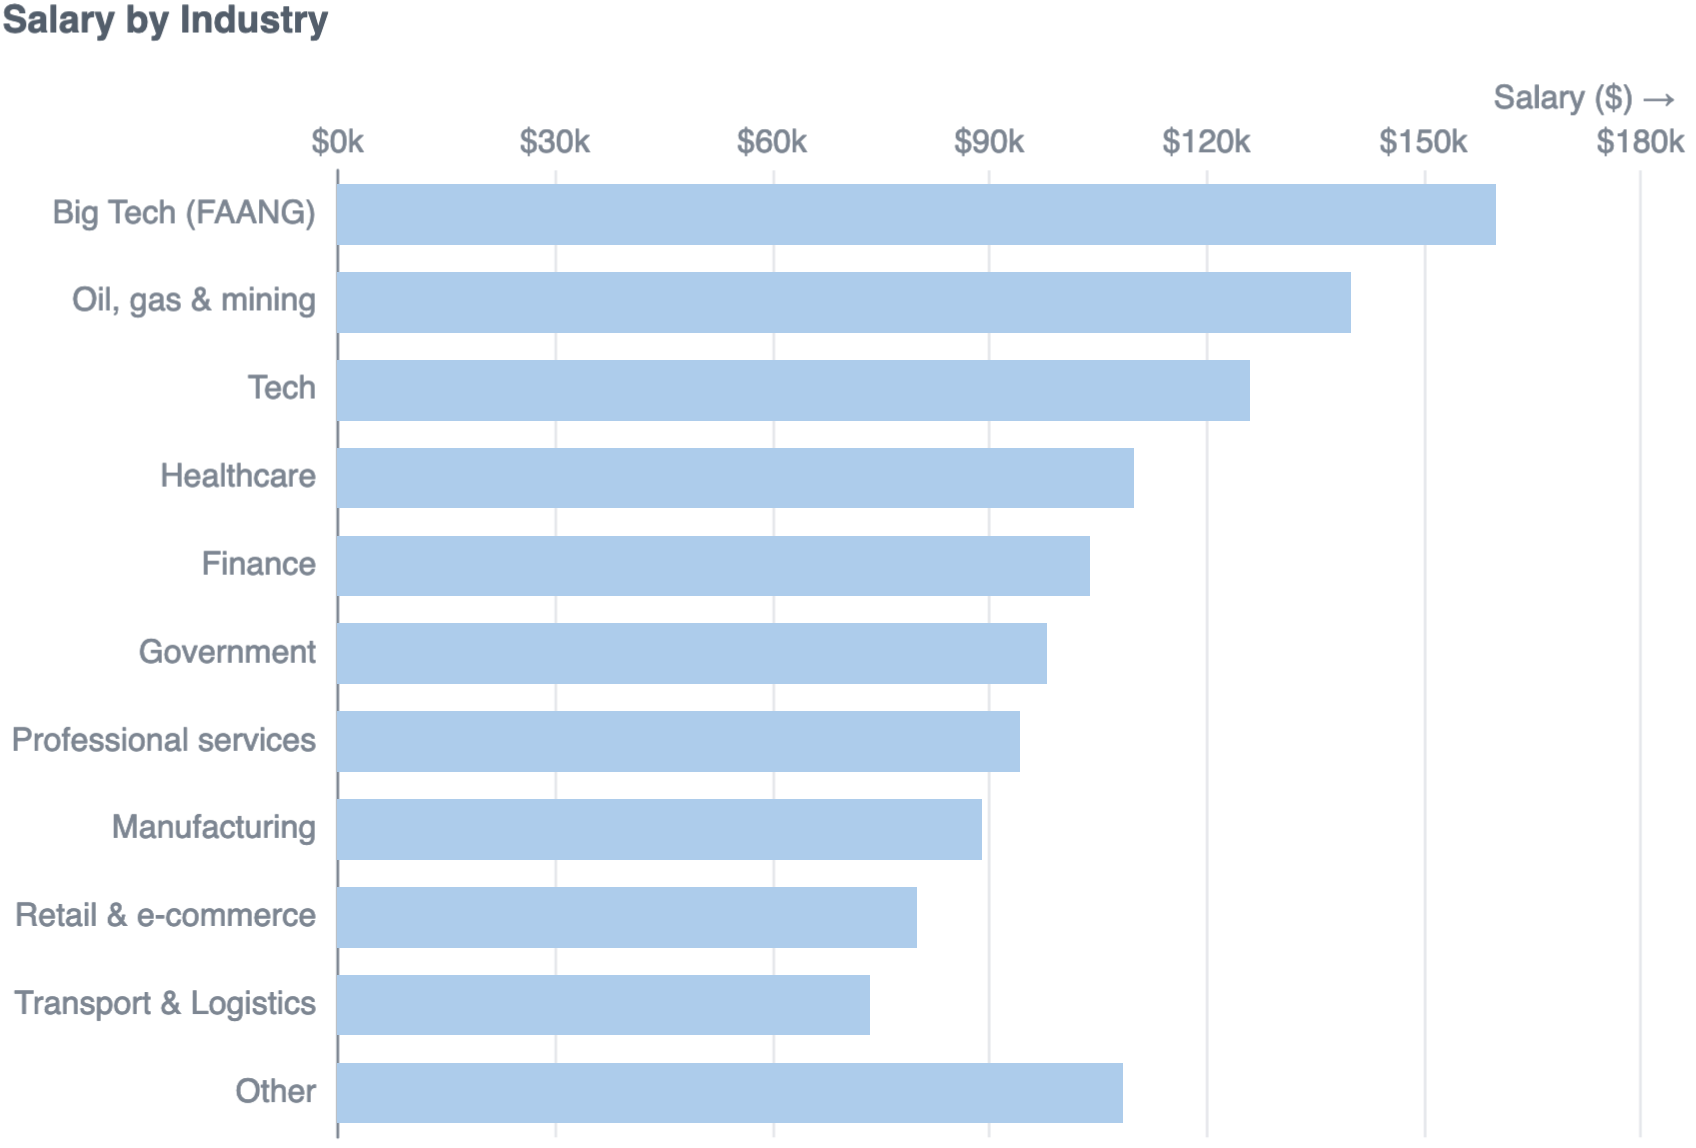
Perhaps unsurprisingly, landing a job at FAANG is a good way to increase your salary. After that, O&G, Tech and Healthcare are all good bets for higher salaries.
If you are working in consulting, manufacturing, retail or logistics - you might be able to get a $20-30k boost by changing industry.
Wrapping up: Top tips for a higher salary
In summary, from the data that’s been posted on Reddit:
- Data science salaries have been going up at 7-9% per year If your salary hasn’t kept pace, talk to your manager about it, or consider looking around for a new role.
- Theres a gulf in salaries between the different regions of the US: West coast salaries are almost double those in the Southeast.
- Education matters in data science: PhDs earn $60k more per year than those with Bachelor’s only.
- Not all industries are equal: FAANG roles, other tech firms, O&G and Healthcare are the most lucrative.
I hope you found this useful! I certainly enjoyed exploring the data (cleaned version on GitHub). If there’s anything else you’d like to see, let me know in the comments on Reddit!
